-
Články
- Časopisy
- Kurzy
- Témy
- Kongresy
- Videa
- Podcasty
Body surface area and body weight of Czech adult cancer population
Povrch těla a tělesná hmotnost dospělé české onkologické populace
Téměř všechna konvenční cytostatika se dávkují podle povrchu těla pacienta. Většina monoklonálních protilátek se také dávkuje s ohledem na povrch těla nebo tělesnou hmotnost pacienta. Zatímco v některých evropských zemích existují aktuální informace o antropometrii onkologických pacientů, v České republice taková data chybí. Proto byly vyhodnoceny údaje o povrchu těla a tělesné hmotnosti u dospělých pacientů, kterým byla podávána chemoterapie v Masarykově onkologickém ústavu v letech 2013–2014. Celkový počet zhodnocených pacientů dosáhl 3873, z toho 2476 žen a 1397 mužů. Průměrný povrch těla u žen byl 1,78 m2 (95% interval spolehlivosti (CI) 1,77–1,79 m2), u mužů 2,00 m2 (95% CI 1,99–2,01 m2), celkově pak 1,86 m2 (95% CI 1,85–1,87 m2). Průměrná tělesná hmotnost byla užen 71,94kg (95% CI 71,35–72,53 kg), umužů 83,43kg (95% CI 82,60–84,26 kg), celkem 76,09kg (95% CI 75,58–76,60 kg).
Klíčová slova:
povrch těla • tělesná hmotnost • chemoterapie • antropometrie
Authors: Roman Goněc; Irena Macků; Iveta Selingerová; Šárka Kozáková
Published in the journal: Čes. slov. Farm., 2015; 64, 264-268
Category: Původní práce
Summary
Almost all conventional cytostatics are dosed according to body surface area of the patient. Many monoclonal antibodies are also dosed with respect to body surface area or body weight of the patient. While in some European countries, there is recent information describing the anthropometrics of the cancer population, no data are available for Czech population. That is the reason why body surface area and weight of adult patients who were administered chemotherapy at Masaryk Memorial Cancer Institute in 2013 and 2014 were evaluated. The total number of evaluated patients was 3873, consisting of 2476 women and 1397 men. The mean body surface area was 1.78 m2 (95% confidence interval (CI) 1.77–1.79 m2) for women, 2.00 m2 (95% CI 1.99–2.01 m2) for men, and 1.86 m2 (95% CI 1.85–1.87 m2) in total. The mean body weight was 71.94kg for women (95% CI 71.35–72.53 kg), 83.43kg (95% CI 82.60–84.26 kg) for men, and 76.09kg (95% CI 75.58–76.60 kg) in total.
Key words:
body surface area • body weight • chemotherapy •Introduction
The current balance concerning dosing of intravenous chemotherapy is leaned heavily towards dosing according to body surface area (BSA) or body weight1). Carboplatin is dosed according to renal functions that are calculated from estimated glomerular filtration rate2), nevertheless, estimated glomerular filtration rate is calculated usually from body weight3). Fixed dosing has prevailed only in case of three monoclonal antibodies: trastuzumab administered subcutaneously (600 mg), obinutuzumab (1000 mg), and pertuzumab (saturation dose 840 mg, maintenance dose 420 mg). Physiologic functions of the patient, as basal metabolic rate, hepatic function, and renal function are related to body size. Since its start, the dosing of chemotherapy has been based on body surface area4). However, the inter-patient variability is so high, that in many drugs the drug exposure predicted according to body surface area differs significantly from real pharmacokinetics. Beside 5-fluorouracil, which is the most frequently used cytostatic at all, another notable examples include irinotecan and etoposide5, 6). The whole conception of using body surface area for dose calculations has been much discussed recently; however, no satisfactory alternative has been suggested so far7, 8).
Recently, the use of dose-banding has been suggested. The method is based on rounding the dose up or down to a predefined dose, thus shortening patient waiting and improving pharmacy work planning. The maximum variation of the adjustment between the standard dose and the doses constituting each band should be 5% or less9). No significant differences in pharmacokinetic parameters between conservative BSA-based dosing and dose banding were found10). The dose of oral cytostatics has to be rounded to a much higher tolerance anyway. Logarithmic dosing, an improved version of dose banding, has been put in use in several hospitals11).
The most widely used formula for body surface area calculation is the Du Bois and Du Bois formula, which is used in Masaryk Memorial Cancer Institute, as well. The Du Bois brothers (the physician and the biologist-statistician) devised the formula [1] in 191612). While mustard gas, the predecessor of alkylation cytostatics, was put in use in European trenches, the American brothers researched body heat loss during drowning. For their experiment they invented a formula that was easy to calculate. They chose 9 subjects of very different body built, including an adolescent boy, a short obese woman, a cretin, and a tall thin man to confirm that the formula is reliable.
BSA = 0.007184 ⋅ H0.725 ⋅ W0.425, [1]
where H stands for body height, W stands for body weight (valid for all subsequent equations, as well).
The formula was “rediscovered” for use in chemotherapy in 1950s13, 14) when the researchers used it to scale up doses from animals to humans. Later, the suitability of this formula for neonates and pregnant women was confirmed15).
In 1930s, Boyd introduced another formula that was based on results from 411 subjects16) [2]:
BSA = 0.017827 ⋅ H0.5 ⋅ W0.4838. [2]
In 1970, Gehan and George evaluated 401 subjects and presented their formula17) [3]. This formula was modified by Mosteller in 198718) [4]. Mosteller’s formula is easy to calculate on pocket calculator, but with ongoing computerization of both research and healthcare this advantage lost its significance.
BSA = 0.0235 ⋅ H0.42246 ⋅ W0.51456, [3]
BSA = √H ⋅ W/3600. [4]
Mosteller’s formula is also suitable for children19) and is more precise for obese patients than the DuBois and DuBois formula20).
In Japan, since 1968 Fujimoto’s formula has been in standard use21) [5]. This formula is based on study of 201 strictly Japanese subjects.
BSA = 0.008883 ⋅ H0.663 ⋅ W0.444 [5]
The DuBois and DuBois formula is used as standard in most countries. The differences between particular formulas do not amount to more than 5% and for clinical purposes, they can be considered identical21).
Because new cytostatics, both conventional and targeted therapy, are very expensive, the healthcare providers, insurance companies and the governmental agencies need to know the costs of particular protocol for an average patient, i.e. annual costs for a patient with average body surface area or average body weight. The textbook value of average body surface area 1.73 m2 is both based on incorrect methodology and very old; its significance at present time is more than doubtful22).
It is not possible to estimate anthropometric data for the whole Czech population. However, the conscription data show that the male population has grown taller and heavier in the 20th century23). It is also clear, that there has to be a difference between genders. Concerning oncological patients, a difference between particular cancer diagnoses can be expected.
Already, there are some recent data on current body surface area in the other parts of the world. In Australia, 2838 patients receiving chemotherapy between May 1996 and December 2000 were evaluated24). A study in the United Kingdom assessed 3613 patients receiving chemotherapy between January 2005 and December 2005. Furthermore, this study found that there were no differences between patients receiving adjuvant and palliative chemotherapy for the same diagnoses and that there was no statistically significant correlation between age and body surface area25). Australia and the UK lie far from each other but they share common cultural heritage. The lifestyle of Central European population is different; its ethnic composition has not changed for centuries.
The evaluation at Masaryk Memorial Cancer Institute had several objectives. The intention was to find out any statistically significant differences in body surface and body weight values for:
- men and women
- urban and rural population
- particular districts of the country
- particular cancer diagnoses
Attributing particular mean body surface area and body weight to particular sub-diagnosis would help the healthcare authorities to estimate the costs of the therapy.
Experimental part
The evaluation included 3873 patients who were administered chemotherapy in Masaryk Memorial Cancer Institute between 1st January 2013 and 31st December 2014. Patients with any solid tumour were eligible as the centre does not treat hematologic malignancies. Only those patients receiving parenteral chemotherapy were included. Patients on single agent oral chemotherapy were omitted because of technical difficulties with retrieving their data. However, the number of these patients is lower than 2%. The hospital treats adult patients only and no age limit was set. The records of parenteral chemotherapy prescriptions are kept electronically in the Medea pharmacy database. Body weight, body surface area, age, diagnosis, and the place of residence can be obtained easily.
The hospital treats patients mainly from South Moravia, but its professional and scientific level draws patients from the whole country. About 40% of patients live in Brno metropolitan area; about 80% of patients live within 100 km from Brno.
Body weight and height of the patient are measured at each visit to the hospital and the body surface area and dose are recalculated accordingly. Body weight and body surface area of a patient change during his or her life. This may or may not correlate with his or her cancer diagnosis. Therefore, the data for the patient’s first chemotherapy visit in the monitored two-year period were recorded.
The statistic evaluation was performed using Statistica 12 (Statsoft, CZ), using independent two-sample Student’s t-test in case of comparing two populations, and analysis of variance (ANOVA) in case of comparing more than two populations. For comparison between districts as well as diagnoses in women, standard ANOVA comparing means was used, including Scheffé’s method to identify different sets; for comparison between diagnoses in men, non-parametric one-way ANOVA (as modified by Kruskal and Wallis) comparing median values had to be used because the distributions were not homogeneous.
Results and discussion
3873 patients in total were included. This consisted of 2476 women and 1397 men. Uneven distribution between genders can be attributed to the fact that prostate cancer, which is very frequent in men, its incidence being similar to incidence of breast cancer in women26), is not treated by chemotherapy in most patients and so the patients were not eligible for this evaluation.
The mean body weight was 71.94 kg for women, 83.43 kg for men, and 76.09 kg in total. The mean body surface area was 1.78 m2 for women, 2.00 m2 for men, and 1.86 m2 in overall population. The difference in body weight and body surface area between both sexes that was expected is apparent. The body surface area data for both women and men are higher than those observed in British and Australian population (Table 1) as well as higher than textbook value 1.73 m2.
Tab. 1. Comparison of body surface area between countries 
3835 patients, i.e. 99.0%, were of Central European origin, i.e. Czech or belonging to “native” and practically indistinguishable minorities: Slovak, German, Polish, and Roma. Two patients were of Vietnamese origin, one patient of Mongolian origin, and one patient of West-Central African origin. The rest of the non-native population was Caucasian. The data set therefore represents the native population and cannot be generalised to European population.
The age of the patients ranged from 18 to 90 years. The mean age was 58.9 years for women (95% CI 58.4–59.4 years), 60.9 years for men (95% CI 60.2–61.6 years), and 59.6 years in total (95% CI 59.2–60.0). In women, there is small but statistically significant correlation (p < 0.05) between body weight and age. In men, there is small but statistically significant correlation (p < 0.05) between body surface area and age. Scatter plots for age are in Figures 1 to 4.
Fig. 1. Scatter plot correlating body weight to age in women. 95% confidence interval. Body weight = 66.911 + 0.08471* age. Pearson correlation coefficient 0.068. 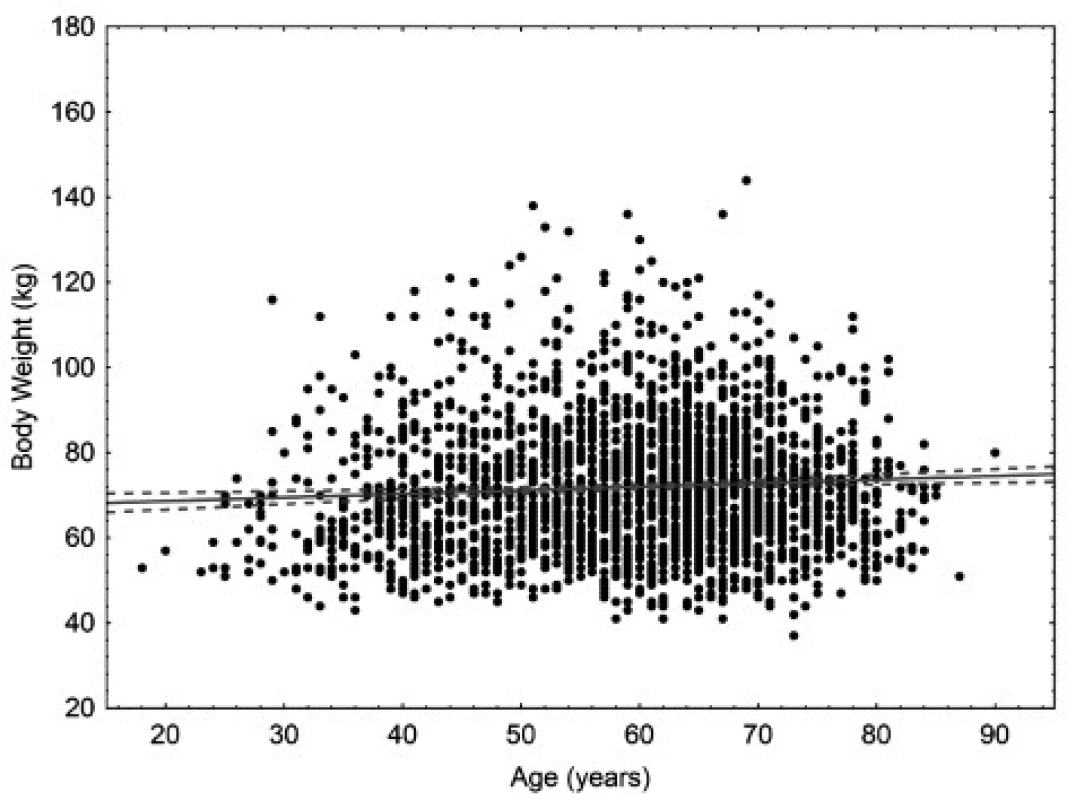
Fig. 2. Scatter plot correlating body weight to age in men. 95% confidence interval. Body weight = 86.767 – 0.0532* age. Pearson correlation coefficient –0.045. 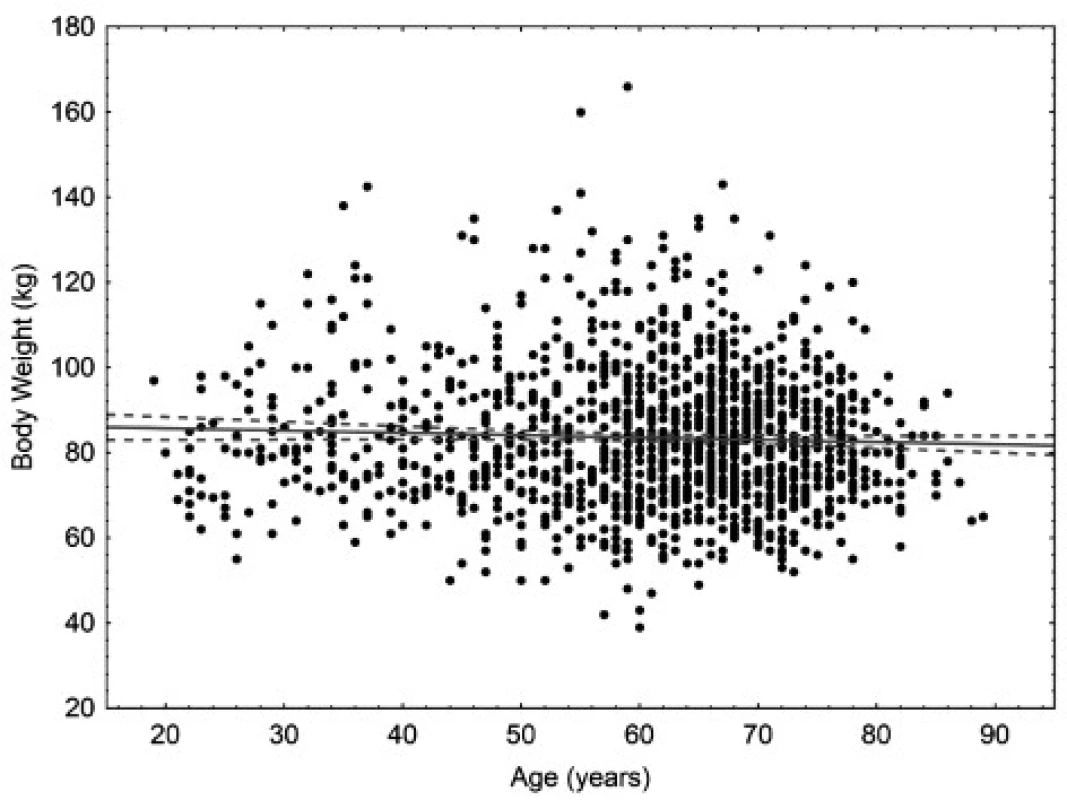
Fig. 3. Scatter plot correlating body surface area to age in women. 95% confidence interval. Body surface area = 1.7964 – 0.003* age. Pearson correlation coefficient –0.023. 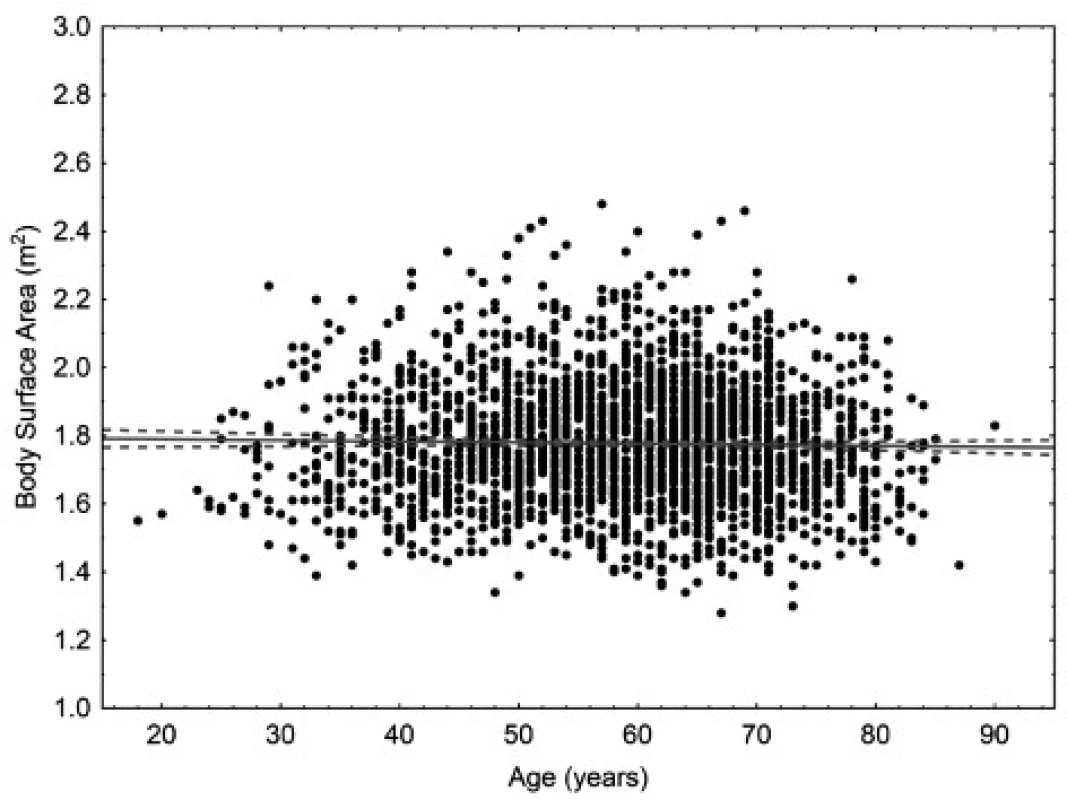
Fig. 4. Scatter plot correlating body surface area to age in men. 95% confidence interval. Body surface area = 2.1094–0.0018* age. Pearson correlation coefficient –0.127. 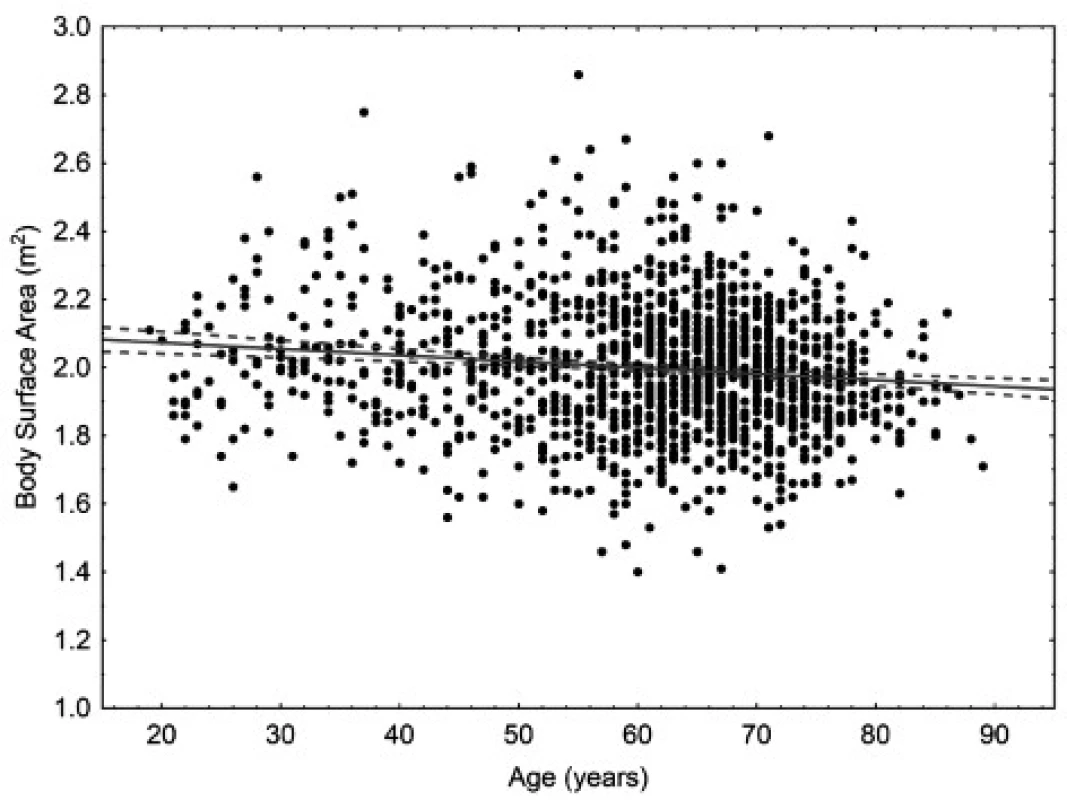
1582 patients live in rural areas and 2290 patients live in urban areas. For the purpose of this evaluation, urban area is defined as a town with more than 3000 inhabitants or a village adjacent to such a town. Urban population has better access to healthcare, on the other hand, it is expected to live with more stress and in more toxic environment; some differences in lifestyle can also be expected. In women, the mean body weight was 73.12 kg (95% CI 72.24–74.17 kg) for rural population and 71.06 kg (95% CI 70.37–71.87 kg) for urban population; in men, the mean body weight was 84.14 kg (95% CI 82.77–85.41 kg) for rural population and 83.08 kg (95% CI 81.97–84.13 kg) for urban population. The difference is statistically significant in women (p < 0.005) but not in men (p = 0.22). In women, the mean body surface area was 1.79 m2 for rural population (95% CI 1.78–1.80 m2) and 1.78 m2 (95% CI 1.77–1.79 m2) for urban population; in men, the mean body surface area was 2.00 m2 (95% CI 1.98–2.02 m2) for rural population and 2.00 m2 (95% CI 1.99–2.01 m2) for urban population. The difference is statistically significant in women (p < 0.05) but not in men (p = 0.55).
Mean body weight and body surface area data for various districts are shown in Table 2. Between these most frequently represented districts (at least 100 patients living in each one), there was no statistically significant difference either in body weight (p = 0.35) or body surface area (p = 0.31).
Tab. 2. Mean body weight and mean body surface area for particular districts 
The evaluation was also focused on differences related to the diagnosis of the patient. The mean values for particular diagnoses are listed in Tables 3 and 4. Both in women and men, body surface area and body weight of patients with upper gastro-intestinal (GI) cancer differed significantly from patients with lung, or colorectal cancer (p < 0.05), in women also with breast and ovary cancer (< 0.0005). The difference between patients with head and neck cancer and the other diagnoses was obvious but not statistically significant. This is caused probably by the fact that upper GI cancer patients are more prone to be undernourished or to suffer from malnutrition. However, no pattern was found when comparing body surface area according to diagnosis. The relation between particular diagnosis and anthropometric data requires further evaluation and larger data sets to obtain significant results.
Tab. 3. Mean body weight and mean body surface area for particular diagnoses in women 
Tab. 4. Mean body weight and mean body surface area for particular diagnoses in men 
Conclusion
While in some countries there is recent information describing the anthropometrics of the cancer population, no data were available for Czech population. That is the reason for the evaluation of body surface area and body weight of adult patients who were administered chemotherapy at Masaryk Memorial Cancer Institute in a 48-months period. The results are very robust and can be extrapolated not only to the non-cancer Czech population but also to the populations of other Central European countries. Body weight and body surface area of a population change in time with respect to lifestyle, political and economical conditions. Precise and recent knowledge of these data is therefore essential for any predictions concerning the costs of the chemotherapy, which is very expensive. Even a slight change in population body weight or body surface area will lead to significant change in costs. Furthermore, the data offer an insight to the anthropometric characteristics of Czech population in general and can be of use in other fields of medicine, as well.
Supported by the project MEYS-NPS I-LO1413.
Conflicts of interest: none.
Received 29 September 2015
Accepted 12 November 2015
Mgr. Roman Goněc • I. Macků
Hospital Pharmacy, Masaryk Memorial Cancer Institute, Brno, Czech Republic
Faculty of Pharmacy, Veterinary and Pharmaceutical University Brno, Czech Republic
Palackého tř. 1/3, 612 42 Brno
e-mail: roman.gonec@mou.cz
Š. Kozáková
Hospital Pharmacy, Masaryk Memorial Cancer Institute, Brno, Czech Republic
I. Selingerová
RECAMO, Masaryk Memorial Cancer Institute, Brno, Czech Republic
Department of Mathematics and Statistics, Faculty of Science, Masaryk University, Brno, Czech Republic
Zdroje
1. Kaestner S. A., Sewell G. J. Chemotherapy dosing part I: scientific basis for current practice and use of body surface area. Clin. Oncol. (R. Coll. Radiol.) 2007; 19, 23–37. doi:10.1016/j.clon.2006.10.010
2. Calvert A. H., Newell D. R., Gumbrell L. A., O’Reilly S., Burnell M., Boxall F. E., Siddik Z. H., Judson I. R., Gore M. E., Wiltshaw E. Carboplatin dosage: prospective evaluation of a simple formula based on renal function. J. Clin. Oncol. 1989; 7, 1748–1756.
3. Cockcroft D. W., Gault M. H. Prediction of creatinine clearance from serum creatinine. Nephron 1976; 16(1), 31–41.
4. Sawyer M., Ratain M. J. Body surface area as a determinant of pharmacokinetics and drug dosing. Invest New Drugs 2001; 19, 171–177. doi:10.1023/A:1010639201787
5. Undevia S. D., Gomez-Abuin G., Ratain M. J. Pharmacokinetic variability of anticancer agents. Nat Rev Cancer 2005; 5, 447–458. doi:10.1038/nrc1629
6. Gurney H. Dose calculation of anticancer drugs: a review of the current practice and introduction of an alternative. J. Clin. Oncol. 1996; 14, 2590–2611.
7. Felici A., Verweij J., Sparreboom A. Dosing strategies for anticancer drugs: The good, the bad and body-surface area. Eur. J. Cancer 2002; 38, 1677–1684. doi:10.1016/S0959-8049(02)00151-X
8. Mathijssen R. H. J., de Jong F. A., Loos W. J., van der Bol J. M., Verweij J., Sparreboom A. Flat-fixed dosing versus body surface area–based dosing of anticancer drugs in adults: does it make a difference? The Oncologist 2007; 12(8), 913–923. doi:10.1634/theoncologist.12-8-913
9. Plumridge R. J., Sewell G. J. Dose-banding of cytotoxic drugs: a new concept in cancer chemotherapy. Am. J. Health Syst. Pharm. 2001; 58(18), 1760–1764. doi:10.1038/bjc.2012.357
10. Chatelut E., White-Koning M. L., Mathijssen R. H. J., Puisset F., Baker S. D., Sparreboom A. Dose banding as an alternative to body surface area-based dosing of chemotherapeutic agents. BJC 2012; 107, 1100–1106. doi:10.1038/bjc.2012.357
11. Zavery B., Marsh G. Could logarithmic dosing change the way cytotoxics are prescribed? Clinical Pharmacist 2011; 3, 116–118.
12. DuBois D., DuBois E. F. A formula to estimate the approximate surface area if height and weight be known. Arch. Internal. Med. 1916; 17, 863–871.
13. Pinkel D. The use of body surface area as a criterion of drug dosage in cancer chemotherapy. Cancer Res. 1958; 18, 853–856.
14. Freireich E. J., Gehan E. A., Rall D. P., Schmidt L. H., Skipper H. E. Quantitative comparison of toxicity of anticancer agents in mouse, rat, dog, monkey, and man. Cancer Chemother. Rep. 1966; 50, 219–244.
15. Wang Y., Moss J., Thisted R. Predictors of body surface area. J. Clin. Anesth. 1992; 4, 4–10.
16. Boyd E. Experimental error inherent in measuring growing human body. Am. J. Physiol. 1930; 13, 389–432.
17. Gehan E. A., George S. L. Estimation of human body surface area from height and weight. Cancer Chemother. Rep. 1970; 54, 225–235.
18. Mosteller R. D. Simplified calculation of body-surface area. N. Engl. J. Med. 1987; 317, 1098.
19. Lam T. K. K., Leung D. T. Y. More on simplified calculation of body surface area. N. Engl. J. Med. 1988; 318, 1130.
20. Verbraecken J., Van de Heyning P., De Backer W., Van Gaal L. Body surface area in normal-weight, overweight, and obese adults. A comparison study. Metabolism 2006; 55, 515–524. doi:10.1016/j.metabol.2005.11.004
21. Fujimoto S., Watanabe T., Sakamoto A., Yukawa K., Morimoto K. Studies on the physical surface area of Japanese. 18. Calculation formulae in three stages over all ages. Nippon Eiseigaku Zasshi 1968; 5, 443–450.
22. Heaf J. G. The origin of the 1.73 m2 body surface area normalization: problems and implications. Clin. Physiol. Funct. Imaging 2007; 27(3), 135–137. doi:10.1111/j.1475-097X.2006.00718.x
23. Jirkovský D. Body height and weight in young men aged 18−25 in the second half of the 20th century. Mil. Med. Sci. Lett. 2003; 72(5), 217–220.
24. Dooley M. J., Singh S., Michael M. Implications of dose rounding of chemotherapy to the nearest vial size. Support Care Cancer 2004; 12, 653–656.
25. Sacco J. J., Botten J., Macbeth F., Bagust A., Clark P. The average body surface area of adult cancer patients in the UK: a multicentre retrospective study. PLoS ONE 2010; 5(1), e8933. doi:10.1371/journal.pone.0008933
26. SVOD. http://www.svod.cz/?sec=aktuality&lang=en, data for year 2012; access date 20th July 2015.
Štítky
Farmácia Farmakológia
Článok vyšiel v časopiseČeská a slovenská farmacie
2015 Číslo 6-
Všetky články tohto čísla
- Antibakteriální účinky přírodních látek – silice
- Organická syntéza, Laboratórny manuál
- Cholinergický systém srdca
- Proběhl 42. mezinárodní kongres k dějinám farmacie
- Povrch těla a tělesná hmotnost dospělé české onkologické populace
- Stable gold nanoparticles – synthesis, bioconjugation and application
- Determination of antigripal drugs (pheniramine, phenylephrine) in biological samples by on-line CITP-CZE coupled with tandem mass spectrometry
- Development of the hydrocortisone butyrate qualitative determination method
- Estimation of lipohydrophilic properties of molecules with potential β3-agonistic activity
- Determination of the colorants in vitamin E by HPLC with photodiode array detection
- Analysis of flavonoids in grape leaves by HPLC-DAD-MS/MS
- Antioxidative protection of inactivated rabies vaccine with squalene adjuvant by β-carotene
- From an old drug to a new one: Synthesis of valproate from 5,5-dipropylbarbituric acid
- Synthesis and antimicrobial activity of novel sulfonamide derivatives
- Synthesis and antioxidant activity of phenylcarbamic acid derivatives acting on the cardiovascular system
- Synthesis and biological activity of selected cinnamic acid derivatives
- Synthesis and biological properties of chosen symmetrical amides and thioamides of terephthalic acid
- Synthesis of quinoline derivatives using a nano-Pd/Cu catalyst in the search of new fluorophores
- Synthesis of triclosan derivatives and their antimycobacterial effect
- The development of a dental drug in the form of medicated chewing gum
- Sympozia Sekce dějin farmacie ČFS v roce 2015
- Autorský rejstřík
- Česká a slovenská farmacie
- Archív čísel
- Aktuálne číslo
- Informácie o časopise
Najčítanejšie v tomto čísle- Antibakteriální účinky přírodních látek – silice
- Povrch těla a tělesná hmotnost dospělé české onkologické populace
- Cholinergický systém srdca
- Organická syntéza, Laboratórny manuál
Prihlásenie#ADS_BOTTOM_SCRIPTS#Zabudnuté hesloZadajte e-mailovú adresu, s ktorou ste vytvárali účet. Budú Vám na ňu zasielané informácie k nastaveniu nového hesla.
- Časopisy


