Spectral analysis of atrial components of ablation catheter signals during slow pathway ablation for typical atrioventricular nodal reentrant tachycardia
Ablation of the slow pathway is the treatment standard for typical atrioventricular nodal reentrant tachycardia (AVNRT). However, the risk of complete heart block due to ablation of the fast pathway remains approximately 1 %. Spectral analysis of the atrial components of ablation catheter signals during slow pathway ablation can provide additional information for precisely defining ablation sites. A retrospective study of the atrial components of 70 ablation catheter signals obtained from 20 patients was performed. Signals immediately prior to ablations were analyzed. The signals were divided into two groups: “good” (desired ablation answer) and “bad.” MATLAB software was used to analyze the signals. The amplitude spectrum received most attention. Afterwards, we compared similarities between “good” and “bad” signals from one patient using cross-correlation. The study population consisted of 20 patients. Each patient had one “good” signal and two or more “bad” signals. The mean frequency of the “good” signals was 13.37 ± 6.78 Hz and of the “bad” signals was 15.79 ± 6.82 Hz (p = n.s.). The relationship between “good” and “bad” signals was 0.73 ± 0.19. The amplitude spectrum of the atrial components of ablation catheter signals did not provide any useful differentiation for improving ablation accuracy.
Keywords:
AVNRT, spectral analysis, slow pathway
Authors:
Jana Žďárská 1,2; Pavel Osmančík 1,2; Ivona Hošková 1; Dalibor Heřman 1; Lukáš Kučera 3
Authors place of work:
Department of Arrhythmology, Third Internal Cardiology Clinic, Vinohrady Teaching Hospital, Prague, Czech Republic
1; Third Faculty of Medicine, Charles University, Prague, Czech Republic
2; Joint department of biomedical engineering CTU and First Faculty of Medicine Charles University, Prague, Czech Republic
3
Published in the journal:
Lékař a technika - Clinician and Technology No. 4, 2015, 45, 115-121
Category:
Původní práce
Summary
Ablation of the slow pathway is the treatment standard for typical atrioventricular nodal reentrant tachycardia (AVNRT). However, the risk of complete heart block due to ablation of the fast pathway remains approximately 1 %. Spectral analysis of the atrial components of ablation catheter signals during slow pathway ablation can provide additional information for precisely defining ablation sites. A retrospective study of the atrial components of 70 ablation catheter signals obtained from 20 patients was performed. Signals immediately prior to ablations were analyzed. The signals were divided into two groups: “good” (desired ablation answer) and “bad.” MATLAB software was used to analyze the signals. The amplitude spectrum received most attention. Afterwards, we compared similarities between “good” and “bad” signals from one patient using cross-correlation. The study population consisted of 20 patients. Each patient had one “good” signal and two or more “bad” signals. The mean frequency of the “good” signals was 13.37 ± 6.78 Hz and of the “bad” signals was 15.79 ± 6.82 Hz (p = n.s.). The relationship between “good” and “bad” signals was 0.73 ± 0.19. The amplitude spectrum of the atrial components of ablation catheter signals did not provide any useful differentiation for improving ablation accuracy.
Keywords:
AVNRT, spectral analysis, slow pathway
Introduction
Radiofrequency ablation (RFA) of the slow pathway has become the gold standard in the treatment of atrioventricular nodal reentrant tachycardia (AVNRT).
The success rate of this method is greater than 95% [1]. However, the risk of complete heart block due to ablation of the compact portion of the AV node or fast pathway remains approximately 1% [2]. In many cases, it is difficult to determine the precise ablation site, although, there are several guidelines for determining the approximate location [3]. An appropriate signal on the ablation catheter or emergence of a junctional rhythm, during RFA, is a marker for a successful catheter ablation [4]. We hypothesized that the signals from the slow pathway could have a slightly different spectral analysis compared to signals from the surrounding area. If there were differences between them in the time domain, then it might be impossible to recognize them visually. A cross-correlation, which is a more sensitive method than visual assessment alone, was used to calculate the similarity between signals. The second step was a spectral analysis of the signals. We postulated that a spectral analysis of the atrial components of ablation catheter signals could provide additional information for precisely defining each ablation site.
Patients and Methods
Patients
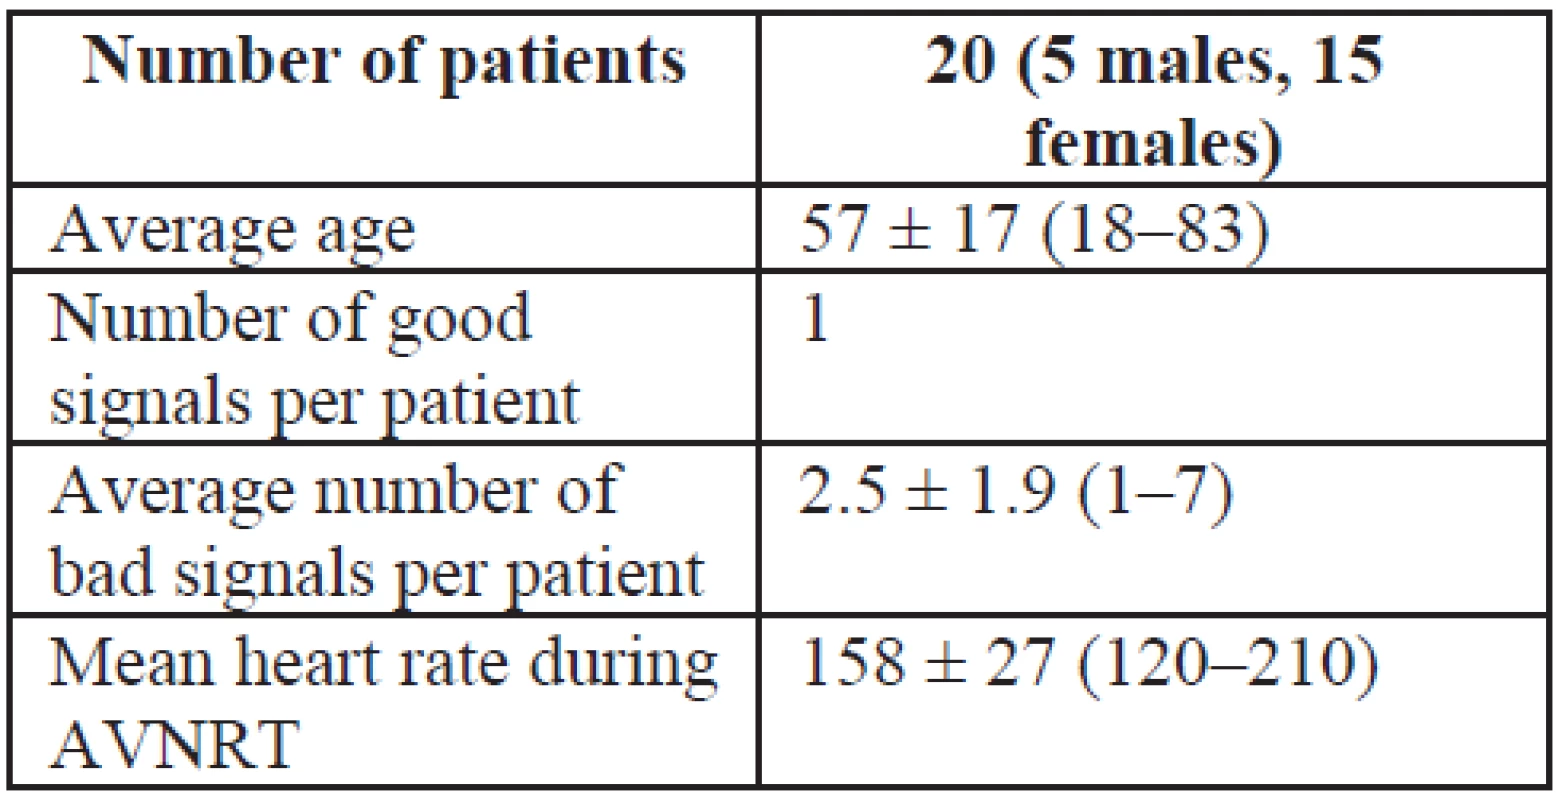
Patients presenting with a typical (slow-fast) form of AVNRT were recruited from January 2012 to October 2013. A retrospective study of the atrial components of ablation catheter signals was then performed. Seventy signals obtained from 20 (15 women, 5 men, average age 57) patients were studied.
The study was approved by the local Ethics Committee and written informed consent was obtained from all patients. Prior to the electrophysiological (EP) procedure, all patients were documented as having supraventricular tachycardia that was presumed to be AVNRT based on a 12-lead ECG and the presentation of typical symptoms. Venous access was achieved using the right femoral vein. A 10-polar (deca-polar) catheter (Dynamic, BARD, USA) was inserted into the coronary sinus (CS) and a quadripolar catheter (Viking, BARD, USA) was inserted on the Bundle of His. Additionally, a 4 mm non-irrigated ablation catheter (Alcath, Biotronik) was inserted into the right ventricle. At the beginning of the EP study, the presence of an accessory pathway was excluded using as set of welldescribed maneuvers (i.e. the activation pattern in the CS during ventricular stimulation and decremental retrograde VA conduction). After this procedure was complete, programmed atrial stimulation was performed. It is common practice in electrophysiology labs to induce AVNRT. When typical AVNRT was not inducible, the presence of an A-H jump (a prolongation of the AH interval > 50 msec) and an atrial echo, with a documented history of supraventricular tachycardia compatible with AVNRT, were sufficient to start the ablation procedure. Between ablations we tested whether AVNRT was still inducible or whether an echo and jump was present. At the end of the procedure all patients were without inducible AVNRT and had no atrial echo.
Only patients with typical (i.e. slow-fast) AVNRT were included in the study; if it was possible to induce an atypical form of AVNRT, the patient was excluded from the study. AV node parameters (AH and HV intervals, and the Wenckebach point) were measured prior to and following ablation. Patients with decreased AV conduction (i.e. suspected fast pathway ablation damage) were also excluded.
Mapping and ablation
The estimated slow pathway area was assessed using an electro-anatomical approach. The initial target zone for mapping was the isthmus of tissue between the tricuspid valve annulus and the CS os [3]. The ablation catheter was inserted into the right ventricle and then moved inferiorly and medially so that it laid anterior to the CS os. It was then withdrawn toward the tricuspid annulus until the distal pair of electrodes recorded a small atrial deflection and a large ventricular deflection with an A/V ratio, on the distal part of the electrode, between approximately 1/10 and 1/3. The objective was to visualize multiple components of the atrial electrogram [3]. If appropriate signals were not found in these anatomical locations, the area between the tricuspid annulus and coronary sinus ostium was mapped until the aforementioned signals were found. The specific slow-pathway signals, previously described by Jackman and Haissaguere, were not specifically mapped [5, 6].
When suitable signals were found, RF energy (using a Stockert EP shuttle) was delivered using the temperature-controlled mode. The power output (30–50 W) of the radiofrequency generator was adjusted according to temperature (50 °C maximum). Energy was supplied based on the ablation response; the expected response was either a junctional rhythm or frequent junctional extrasystoles. If such a response did not occur within approximately 20 seconds, energy delivery was stopped. If the expected response was achieved, the energy delivery was prolonged for a maximum of 60 seconds. Afterward, AVNRT and the presence of an atrial echo and jump were assessed. The procedure was concluded if conduction duality was not present 15 minutes after the last ablation, which was tested with and without isoproterenol.
A LabSystem Pro (Bard, Inc.) was used to record surface ECGs and intracardiac signals. The sampling frequency was 2000 Hz for all analyzed signals. Each signal was filtered with a 0.1–100 Hz band pass filter, which was proposed by Bard.
Signals and statistical analysis
The signals from the ablation catheter were recorded before each ablation. The analysis was done offline after the ablation procedure. The recorded signals were divided into two groups: “good” and “bad” according to the effect of the energy application. Signals obtain before ablation were analyzed. “Good” signals (i.e. signals from each slow pathway) were characterized by 1) a typical junctional rhythm (about 60 bpm) or frequent ectopic beats during RF energy application, and 2) the absence of an atrial echo and jump following a particular ablation. Both conditions had to be met prior to the signal being categorized as “good.” Signals in the same area that were not associated with these two characteristics were categorized as “bad” signals. Each patient had, at least, one “good” signal and one (or more) “bad” signals. With regard to “good” signals, only those signals measured before the first successful ablation (when two ablations were done on the same spot the signals before the second ablation could be influenced by the first) were analyzed. In recurrences of slow pathway conduction following a successful ablation, no additional “good” signals were analyzed, which excluded possible signal changes due to edema associated with repeated ablations.
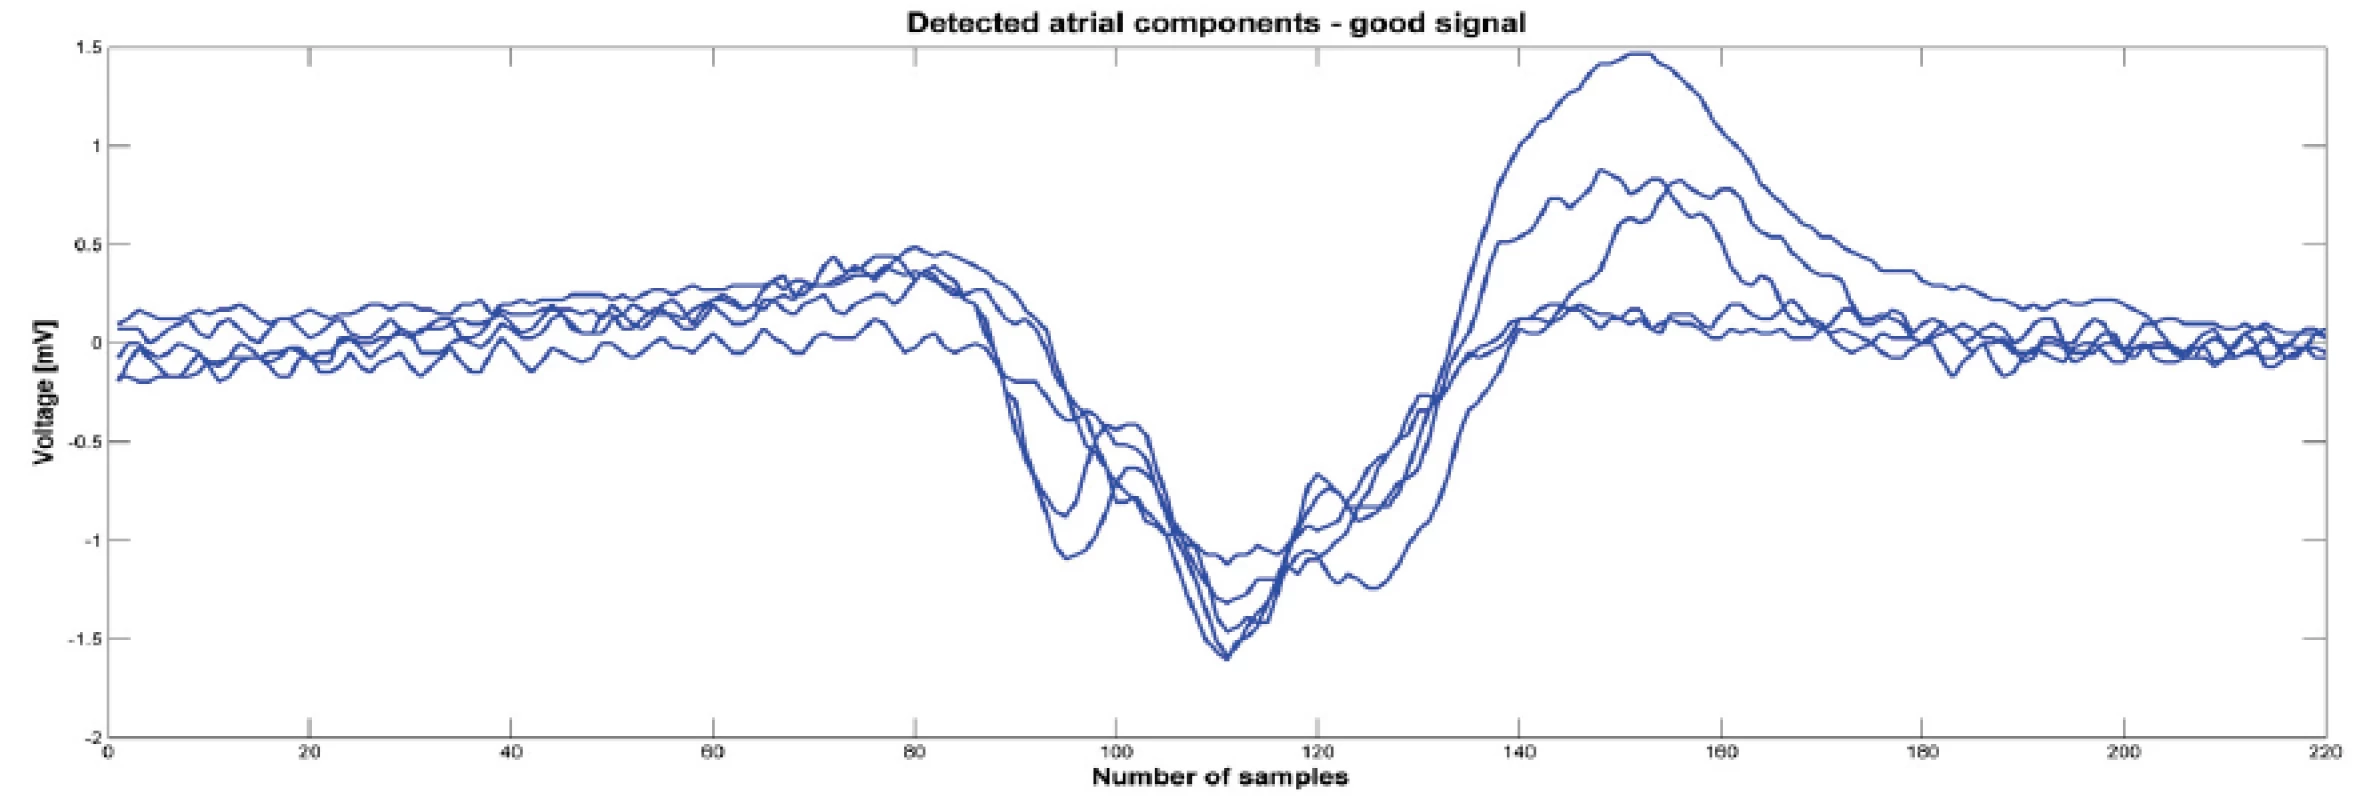
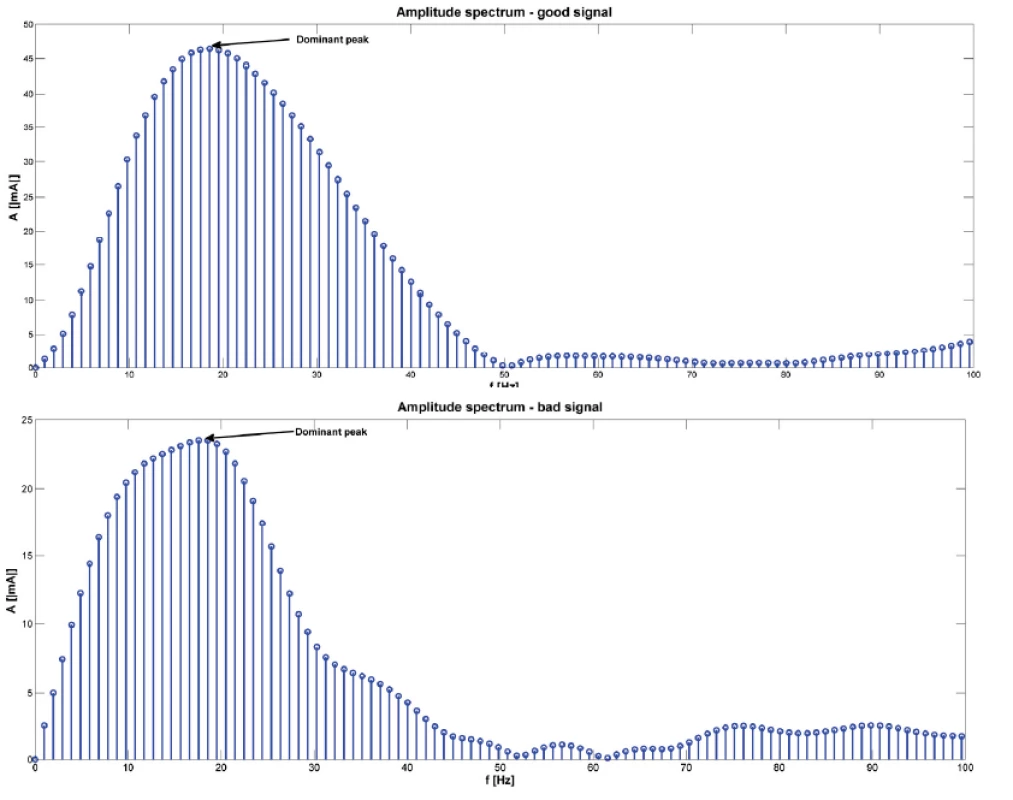
MATLAB R2013a was used for signal processing. Software with a graphical user interface (GUI) for signal analysis was created for this project. Thanks to the program, we were able to load data from “text” (txt) files exported from the LabSystem. A 1-minute-long signal measured before the start of ablation was exported from the BARD system. Once the “text” files were loaded into the GUI, we chose signals, for analysis, having a duration of four or six seconds, immediately prior to ablation (Fig. 1). During this period, we detected about 5 contractions depending on patient and their current heart rate. We focused on the atrial component of the signal and therefore had to detect the ventricle far-field using thresholding. All detected ventricle far-fields were checked visually. The signal section before the ventricle far-field was used for further analysis (see Fig. 2). The part of the signal before the ventricle far-field was chosen manually based on our experience that there was a brief isoline between the atrial component and ventricle far-field. All atrial components from one patient and one signal had the same length. The minimum of each detected wave was found, and all activation waves were sorted according to the minimum. In order to reduce random events, the program calculated a mean activation wave from the sorted signals (see Fig. 3). Therefore, we had for each period before the ablation the mean wave for further processing. The next step was to obtain the amplitude spectrum of the mean wave. A fast Fourier transform was used to transform the mean wave into a frequency domain (see Fig. 4). Each mean wave was padded with zeros (zero padding) to signal length 2n. In our case we obtain 2048 samples. It is customary to pad each segment with zeroes in order to determine the spectral peak location more precisely.


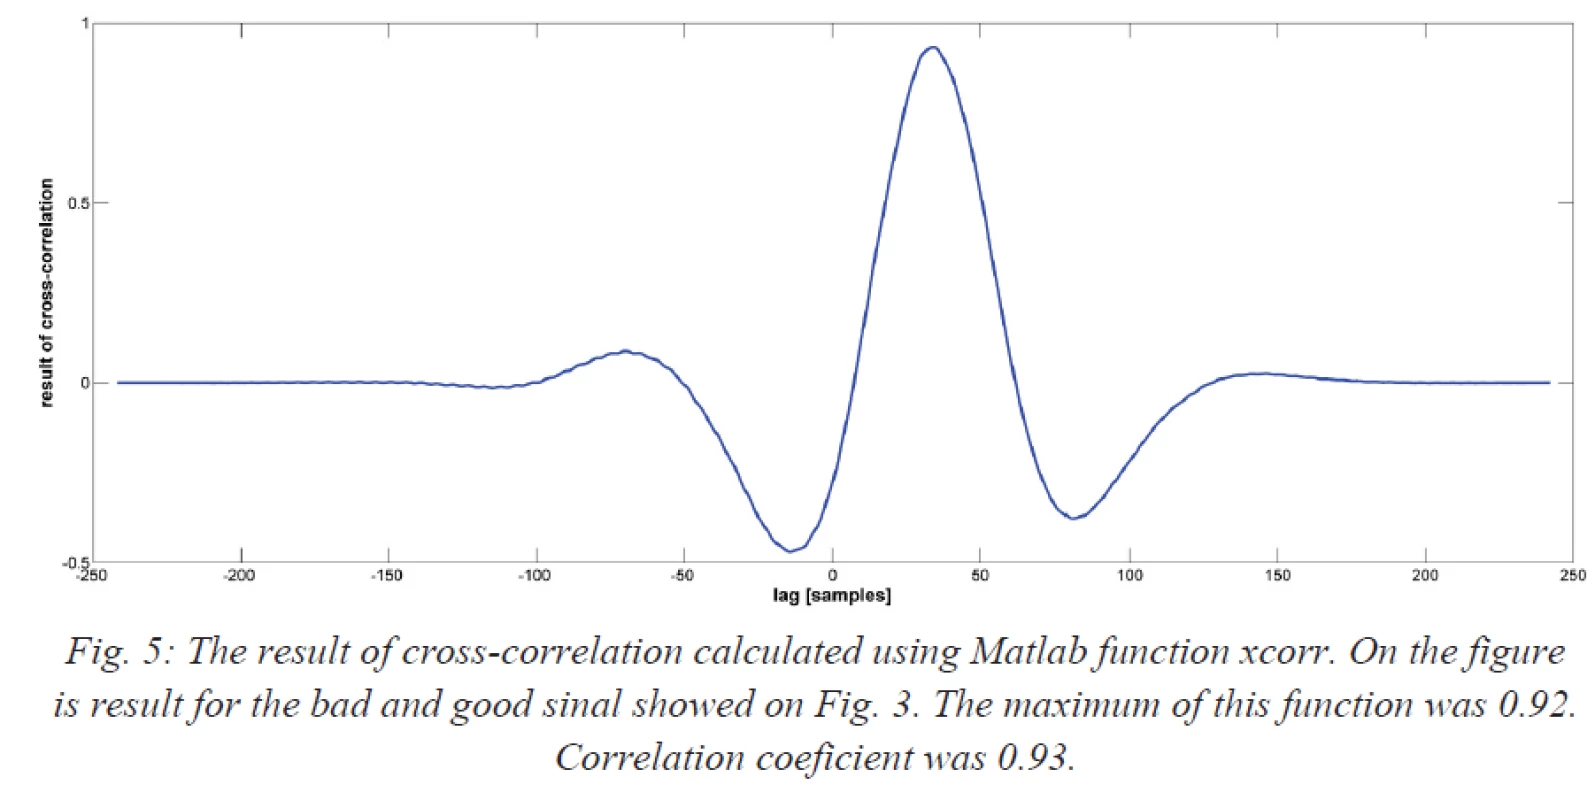
Finally, “good” and “bad” signals were compared using a cross-correlation in the time domain. The cross-correlation was calculated using the Matlab function [c, lag] = xcorr (good signal, bad signal, ‘coeff’). Parameter ‘coeff’ means that the resulting sequence was normalized from −1 to 1. The correlation function was normalized to “1” meaning that signals were identically equal or “0” meaning that signals were not dependent. The correlation coefficient was calculated using the Matlab function R = corrcoef (good signal, bad signal).
Results
Twenty patients (15 females) with typical AVNRT, undergoing RFA of the slow pathway were included in the study. An example of the detected atrial component used for analysis is shown in Fig. 2. An example of the amplitude spectrum of a typical signal is shown in Fig. 4.
Seventy signals were recorded and analyzed: 20 were categorized as “good” signals and 50 as “bad” signals. The mean number of “bad” signal was 2.5 ± 1.9 (range 1–7). The dominant peak in the amplitude spectrum was observed. For each patient, the dominant peak in the amplitude was determined (see Fig. 4). Among the “good” signals, the mean dominant peak in the amplitude spectrum was 13.37 ± 6.78 Hz. Among the “bad” signals, the mean dominant peak was 15.79 ± 6.82 Hz. There was no statistically significant difference between the two groups (P = 0.185). The relationship between “good” and “bad” signals expressed using the cross-correlation (expressed as the maximum value calculated by xcorr) was 0.73 ± 0.19 (see Fig. 5). The correlation coefficient between “good” and “bad” signal was 0.65 ± 0.20.
Discussion
A spectral analysis of the atrial component of signals prior to RF ablation did not result in a successful differentiation of “good” and “bad” signals.
Although the specific slow pathway signal has been described by Haissaguerre and Jackman [5, 6], most electrophysiologists use the electro-anatomical approach. This approach consists of looking for small atrium and large ventricle signals on the ablation catheter with a high frequency, small amplitude, and a multiple-component atrial component in the area between the tricuspid annulus and CS os. Usually, this postero-septal or mid-septal region is mapped. Slow-fast AVNRT typically uses the right anterior extension as an antegrade limb, which lies in the bottom part of the triangle of Koch, and despite inter-patient anatomical differences, the fast pathway rarely lies in this area [7]. The presence of ectopic junctional beats during delivery of RF energy to the site presents a positive signal, and is associated with a high likelihood of AVNRT elimination [8]. Using the electro-anatomical approach, slow pathway signals were not specifically mapped. However, in both electrogram-based and anatomical approaches, small, wide, or fragmented atrial signals should be present on the ablation catheter [9]. In case of a slow pathway, the atrial component should be longer than 40 ms [10].
The slow pathway potential described by Haissaguerre was present shortly after the atrial component, and delayed more to the ventricular component during faster atrial pacing [6]. In high frequency, multi-component atrial signals, the terminal portion might contain the slow pathway potential. On the other hand, the slow pathway potential can be recorded easily in the right atrial postero-septal region with detailed mapping; however, the presence of this signal on the ablation catheter does not specifically predict ablation success [8].
The slow-pathway potential, as described by Haissaguerre et al., was not specifically mapped in our study. Other approaches for typical AVNRT ablation with similar success rates have been described [9, 11, 12]. There are approaches that are more simple, for instance Femenia described an anatomical approach using two catheters with no precise signal mapping on the ablation catheter. Despite this, very good long-term results have been recorded [13]. On the other hand, there are approaches based on very careful mapping of slow pathway potentials. Potentials were obtained conventionally by Haissaguerre [6] and Jackman [5], however, more recently, 3D mapping of the Koch triangle has become possible, as well as recording signals from this area. This allows for a much more targeted ablation [14].
The electrogram-based approach is precise and apparently reduces the length and power of applied RF energy through better localization of the ablated site [14]. However, not even detailed mapping produces 100% success rates, while also avoiding damage to anything but the slow pathway.
During detailed mapping, the slow pathway potential can be recorded easily in the right atrial postero-septal region. Hirao et al., tried to determine the difference between successful and unsuccessful sites of slow pathway ablation. They performed RF ablations in patients with typical AVNRT, but only at sites with slow pathway potentials. Sixty-six sites (38 successful and 28 unsuccessful) with pre-ablation slow pathway signals were analyzed. The ablations performed more anteriorly, or with longer intervals from the atrium to the slow pathway potential, were associated with higher rates of AVNRT elimination [8]. In our study, the results of spectral analysis of “good” and “bad” signals (i.e. either associated or not associated with successful ablations) were very similar and could not be used to differentiate signals associated with successful ablations. Thus, our findings are similar to those of Hirao, who did not use spectral analysis. The signals appear to be visually the same for both successful and unsuccessful ablations. A cross-correlation showed that “good” and “bad” signals, from a single patient, in our study, were very similar, and we were unable to find any significant difference between them.
Based on the results of our study, it appears that the atrial component on the ablation catheter is very similar to the ideal ablation position (positions in which ablation leads to elimination of the slow pathway and AVNRT) compared to those areas that are close to the slow pathway, but where ablation did not lead to the elimination of AVNRT (and the signals here could be very close far-field). Another explanation for the similarity of signals could be the use of the left inferior extension of the AV node in our unsuccessful cases. However, the similarity between “good” and “bad” signals would seem to favor the first explanation.
Limitations
Small sample size; and we did not carry out a spectral analysis of the slow pathway potentials. Also, we did not measure contact forces.
Address for correspondence:
Jana Zdarska, Ing.
III. Interní – kardiologická klinika
Fakultní nemocnice Královské Vinohrady
Šrobárova 1150/50
100 34 Praha
Email: janca.zd@gmail.com
Tel: +420 723 799 516
Zdroje
[1] ISSA Z. F, J. M MILLER and D. P. ZIPES. Clinical arrhythmology and electrophysiology: a companion to Braunwald's heart disease. 2nd ed. Philadelphia, PA: Elseiver/Saunders, c2012, 726 p. ISBN 978-145-5712-748.
[2] CLAGUE, J., N. DAGRES, H. KOTTKAMP et al. Targeting the slow pathway for atrioventricular nodal reentrant tachycardia: initial results and long-term follow-up in 379 consecutive patients. European Heart Journal. 2001;22;1;82-88. DOI:
10.1053/euhj. 2000. 2124. www: http://eurheartj.oxfordjournals.org/cgi/doi/10.1053/euhj.2000.2124
[3] HUANG, S. K. S. a M. WOOD. Catheter ablation of cardiac arrhythmias. 1st ed. Editor Shoei K Huang, Mark A Wood. Philadelphia, PA: Saunders Elsevier, c2006, 691 p. ISBN 978-141-6003-120.
[4] NIKOO M. H., Z. EMKANJOO et al. Can successful radiofrequency ablation of atrioventricular nodal reentrant tachycardia be predicted by pattern of junctional ectopy?. Journal of Electrocardiology. 2008; 41; 1; 39-43. DOI: 10. 1016/j.electrocard.2007.07.005.
www: http://linkinghub.elsevier.com/retrieve/pii/S0022073607006772
[5] JACKMAN W. M., K. J. BECKMAN, J. H. MCCLELLAND et al. Treatment of Supraventricular Tachycardia Due to Atrioventricular Nodal Reentry by Radiofrequency Catheter Ablation of Slow-Pathway Conduction. New England Journal of Medicine. 1992;327;5;313-318. DOI: 10.1056/NEJM199207303270504.
www: http://www.nejm.org/doi/abs/10.1056/NEJM199207303270504
[6] HAISSAGUERRE M., F. GAITA, B. FISCHER et al. Elimination of atrioventricular nodal reentrant tachycardia using discrete slow potentials to guide application of radiofrequency energy. Circulation. 1992;85; 6; 2162-2175. DOI: 10.1161/01.CIR.85.6.2162.
www: http://circ.ahajournals.org/cgi/doi/10.1161/01.CIR.85.6.2162
[7] DELISE P., A. BONSO, L. CORO et al. Pacemapping of the Triangle of Koch: A Simple Method to Reduce the Risk of Atrioventricular Block During Radiofrequency Ablation of Atrioventricular Node Reentrant Tachycardia. Pacing and Clinical Electrophysiology. 2001;24;12;1725-1731. DOI: 10.1046/j.1460-9592.2001.01725.x.
www: http://doi.wiley.com/10.1046/j.1460-9592.2001.01725.x
[8] HIRAO H, Y. MURAOKA, T. YAMAGATA et al. Comparison of properties of slow pathway potential between successful and unsuccessful radiofrequency applications in patients who underwent catheter ablation for atrioventricular nodal reentrant tachycardia. Hiroshima J Med Sci. 2000; 49(1):15-27. PubMed PMID: 10824453.
[9] ENJOJI Y., K. SUGI, T. IKEDA et al. A Simple Technique for Anatomical Slow Pathway Ablation in Atrioventricular Nodal Reentrant Tachycardia. Japanese Heart Journal. 1999;40;5;561-569. DOI: 10.1536/jhj.40.561.
www: http://joi.jlc.jst.go.jp/JST.JSTAGE/jhj/40.561?from=CrossRef
[10] NIGRO G., V. RUSSO, A. RAGO et al. Which parameters describe the electrophysiological properties of successful slow pathway RF ablation in patients with common atrioventricular nodal reentrant tachycardia?. Anadolu Kardiyoloji Dergisi/The Anatolian Journal of Cardiology. 2010-04-08;10;2;126-129. DOI: 10.5152/akd.2010.036.
www: http://www.anakarder.com/eng/makale/1839/69/Full-Text
[11] HAYASHI M., Y. KOBAYASHI, Y. MIYAUCHI et al. A Randomized Comparison of the Straight Linear Approach with Electrogram Mapping Focal Approach in Selective Slow Pathway Ablation. Pacing and Clinical Electrophysiology. 2001, vol. 24, issue 8, p. 1187-1197. DOI: 10.1046/j.1460-9592.2001.01187.x. www: http://doi.wiley.com/10.1046/j.1460-9592.2001.01187.x.
[12] CHIYODA K., Y. KOBAYASHI, Y. JINBO et al. Selective slow pathway ablation in atrioventricular nodal reentrant tachycardia: Comparison of different methods and the site of slow pathway ablation. Japanese Circulation Journal. 1996; 60; 861-870.
[13] FEMENÍA F., M. ARCE, M. ARRIETA et al. Long-term results of slow pathway ablation in patients with atrioventricular nodal reentrant tachycardia: simple approach. Journal of Electrocardiology. 2012; 45; 3; 203-208. DOI: 10.1016/j.jelectrocard.2011.12.007.
www: http://linkinghub.elsevier.com/retrieve/pii/S0022073611005218
[14] KOPELMAN H., S. P. PRATER, F. TONDATO et al. Slow pathway catheter ablation of atrioventricular nodal re-entrant tachycardia guided by electroanatomical mapping: a randomized comparison to the conventional approach. Europace. 2003;5;2;171-174. DOI: 10.1053/eupc.2002.0296. www: http://europace.oxfordjournals.org/cgi/doi/10.1053/eupc.2002.0296
Štítky
BiomedicínaČlánok vyšiel v časopise
Lékař a technika
2015 Číslo 4
Najčítanejšie v tomto čísle
- MERANIE PARAMETROV ELEKTROMAGNETICKÝCH POLÍ PRI POUŽÍVANÍ PROSTRIEDKOV MOBILNEJ KOMUNIKÁCIE V ŠKOLSKOM PROSTREDÍ
- Spectral analysis of atrial components of ablation catheter signals during slow pathway ablation for typical atrioventricular nodal reentrant tachycardia
- Multi-electrode microfluidic platform for protein detection using electrochemical impedance spectroscopy
- Effect of linear accelerator settings on evaluation of dosimetric verification of VMAT plans
