-
Články
- Časopisy
- Kurzy
- Témy
- Kongresy
- Videa
- Podcasty
A Rasch analysis of the Q-LES-Q-SF questionnaire in a cohort of patients with neuropathic pain
Raschova analýza dotazníku Q-LES-Q-SF na podkladě odpovědí pacientů s neuropatickou bolestí
Cíl: Cílem studie bylo ověření měřících vlastností dotazníku kvality života Quality of Life Enjoyment and Satisfaction Questionnaire short form (Q-LES-Q-SF) na podkladě Raschova modelu parciálního kreditu. Soubor a metody: Konsekutivní soubor pacientů s neuropatií (N = 1 301) byl vyšetřen 86 ambulantními neurology. Lékaři zaznamenali pacientův věk, pohlaví, vzdělání, hlavní a přidruženou diagnózu, délku choroby, hodnotu Clinical Global Impression (CGI)-Severity scale a pacienti vyplnili dotazník Q-LES-Q-SF. Výsledky: Nálezy podpořily a) existenci jednodimenzionální struktury nástroje; b) monotónní vzestup volby kategorií na 5bodové hodnotící stupnici; c) adekvátnost operacionalizace konstruktu kvality života; d) absenci podlahového i stropního efektu; e) adekvátní zacílení stupnice; f) absenci různého fungování položek s ohledem na věk, pohlaví a CGI s výjimkou položky referující o spokojenosti se sexuálním životem – starší pacienti byli méně spokojeni v této oblasti života. Závěr:Nálezy přinesly podporu pro uspokojivou shodu dotazníku Q-LES-Q-SF mezi teoretickým očekáváním Raschova modelu a našimi daty. Nástroj je možno akceptovat jako spolehlivý instrument pro odhad kvality života pacientů s neuropatií.
Klíčová slova
Q-LES-Q-SF – Raschův model – neuropatická bolest
Autoři deklarují, že v souvislosti s předmětem studie nemají žádné komerční zájmy.
Redakční rada potvrzuje, že rukopis práce splnil ICMJE kritéria pro publikace zasílané do biomedicínských časopisů.
Authors: J. Kožený 1,2; L. Tišanská 1,2; J. Bednařík 3; C. Höschl 1,2
Published in the journal: Cesk Slov Neurol N 2019; 82(1): 60-67
Category: Původní práce
doi: https://doi.org/10.14735/amcsnn201960Summary
Aim: The purpose of this paper is to establish measurement properties of the Quality of Life Enjoyment and Satisfaction Questionnaire short form (Q-LES-Q-SF) employing the Rasch Masters Partial Credit Model. Patients and methods: Consecutive patients with neuropathy (N = 1,301) were interviewed by 86 out patient care neurologists. The physicians recorded patients‘ gender, age, education, main and associated diagnosis, length of main disease, the Clinical Global Impression (CGI)-Severity scale, and patients filled in the Q-LES-Q-SF questionnaire. Results: The findings establish that a) the instrument is unidimensional; b) 5-point scale categories progress monotonically; c) the construct „quality of life“ was adequately operationalized; d) there was neither floor nor ceiling effect; e) the scale is adequately well targeted; f) there was no differential item functioning found from the viewpoint of gender, age and CGI with exception of the item reflecting sexual drive, interest and/ or performance – older patients were less satisfied with their sexual life. Conclusions: Our analysis brought reliable evidence that the Q-LES-Q-SF questionnaire satisfactorily approximates resemblance between theoretical expectations of the Rasch model and our data, and that the instrument appears to be a reliable instrument for assessment of wellbeing in patients with neuropathy.
Keywords
Q-LES-Q-SF – Rasch model – neuropathic pain
对一组神经性疼痛患者的Q-LES-Q-SF问卷进行Rasch分析
目的:
本文采用Rasch Masters部分信用模型,建立生活享受质量和满意度问卷简表(Q-LES-Q-SF)的测量性质。
患者和方法:
86名门诊神经内科医生对连续的神经病变患者(N = 1,301)进行了访谈。医生记录患者的性别、年龄、教育程度、主要及相关诊断、主要疾病的病程、临床总体印象(CGI)-严重程度量表,并填写Q-LES-Q-SF问卷。
结果:
研究结果表明,a)仪器是一维的;b) 5分量表类别进展单调;c)“生活质量”的概念已充分实施;d)既没有地板效应,也没有天花板效应;e)比额表有充分的目标;f)除了反映性欲、兴趣和/或表现的项目外,没有发现性别、年龄和CGI角度的项目功能差异——年龄较大的患者对他们的性生活不太满意。
结论:
我们的分析提供了可靠的证据,证明Q-LES-Q-SF问卷令人满意地近似于Rasch模型的理论预期与我们的数据之间的相似性,而且该工具似乎是评估神经病患者幸福感的可靠工具。
关键字
Q-LES-Q-SF - Rasch模型-神经性疼痛
Introduction
For a long time there has been a rather consistent general consensus that quality of life is an integral part of the patient‘s health and should be assessed in addition to the somatic health outcomes. In response to this trend, researchers have begun to develop generic tools that address a wide range of life conditions [1,2], and, even in a larger number, tools focused on illness-specific issues [3,4].
Among the most frequently used measures of quality of life in clinical research is a generic tool – the Quality of Life Enjoyment and Satisfaction Questionnaire Short Form (Q-LES-Q-SF).
Psychometric evaluation of the instrument has so far been based on classical test theory, e. g. on responses from adults with attention deficit hyperactivity disorder [5], patients with generalised anxiety disorder [6], or adults with a psychiatric diagnosis [7]. Despite the fact that the scale dimensionality has not been properly tested, the authors recommended the Q-LES-Q-SF as a measure that could produce reliable and valid clinical assessments of quality of life. In some cases, authors even used an improper analytic approach (component factor analysis), e. g. adult patients in primary care clinics [8] and questioned the unidimensionality of the instrument.
The only exceptions are two Bourion-Bédès et al. [9,10] articles reporting psychometric properties of the Q-LES-Q-SF employing a combination of classical test theory and item response theory using responses from 140 patients with polydrug dependence. Their findings supported validity, reliability, and the underlying unidimensionality of the French version of the scale and concluded that it was the robust measure of self-reported health status among substance users. Unfortunately, their documentation of the Rasch analysis was only cursory which makes detailed comparison between their findings and our results problematic.
The purpose of this paper is to establish measurement properties of the instrument using the Rasch Masters Partial Credit Model based on the data from patients with neuropathy. This approach is designed to test not only overall model fit, but also provides information about specific model violation and is, contrary to classical testing theory, item based, group independent, and determines both item-free and person-free parameters estimation within the same model [11]. To our knowledge, the psychometric parameters of the Czech version of Q-LES-Q-SF have not been evaluated using Rasch analysis.
Patients and methods
Data source and sampling
The study was based on a consecutive clinical sample of 1,301 (571 males) outpatients with diagnosed neuropathic pain (NP). The patients were interviewed by 86 physicians specialised in neurology (28 men: age 50.2 ± 7.1 years, practice length 24.7 ± 6.9 years; 58 females: age 48.2 ± 6.8 years, practice length 22.7 ± 6.56 years).
Neurologists were asked to see a minimum of 15 consecutive patients with NP and, in diagnosis, to rely on the International Statistical Classification of Diseases (ICD-10) Version 2016 [12] and the painDETECT screening scale [13] that focuses on the quality of NP symptoms; the scale was made available to them on the website of the study.
The physicians recorded patients‘ gender, age, education, main and associated diagnosis, length of main disease, the Clinical Global Impression (CGI)-Severity scale, and the patients filled in the quality of life questionnaire Q-LES-Q-SF. Description of the sample is presented in Tab. 1.
Tab. 1. Description of patients with neuropathic pain in % (N = 1,301). Unless otherwise stated, the values are expressed as a percentage. 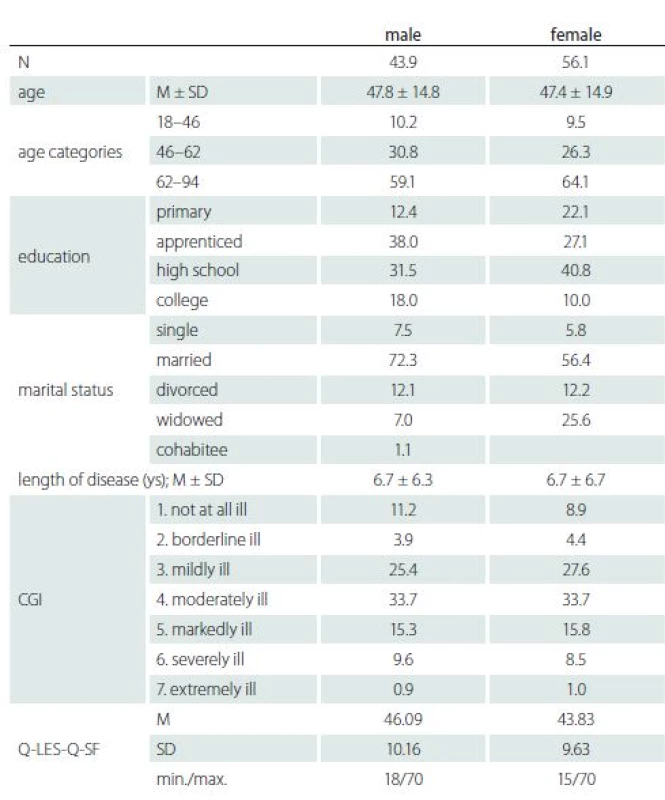
CGI – Clinical Global Impression; M – mean; Q-LES-Q-SF – Quality of Life Enjoyment and Satisfaction Questionnaire short form; SD – standard deviation Table 2 illustrates the frequency of diseases which are probably associated with NP. About 95% of patients had at least one of the diagnoses stated in Tab. 2, and about 88% of them had at least one out of the G60–G64, M40–M54, E11, and G50–G59 diag-noses. Nonetheless, apart from 344 (27.7%) patients who had just one diagnosis, nearly 36% and 24% had two and three diagnoses, resp. The most frequent was an associated diagnosis of E11 with G60–G64 (80%) and with M40–M54 (43%). Other diagnoses occurred in isolated cases represented by one or two persons, the only exception was diagnosis I10–I15 (hypertensive diseases) which was diagnosed in 19 persons.
Tab. 2. Frequency and percentage of diagnoses occurrence. 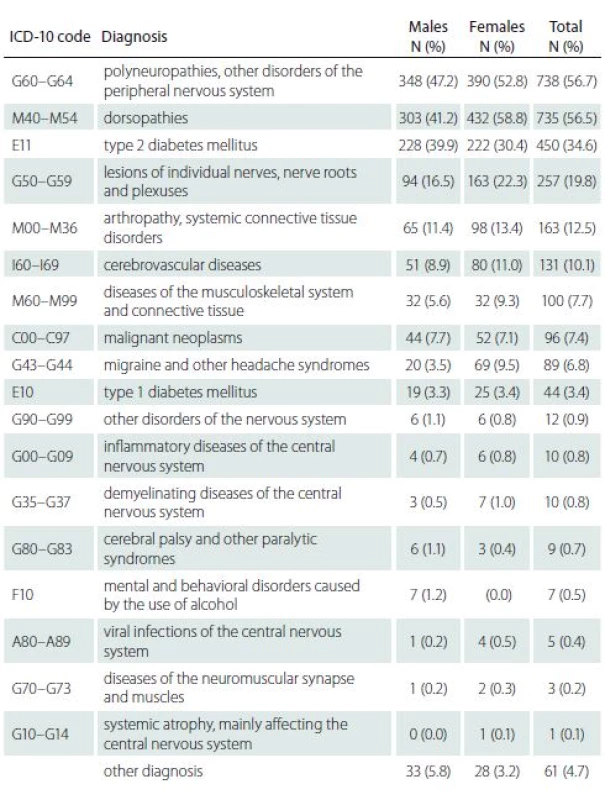
ICD-10 – International Statistical Classification of Diseases The Q-LES-Q-SF questionnaire
The generic Q-LES-Q-SF questionnaire was derived from the original 93-item Q-LES-Q grouped into eight scales [14]. The Q-LES-Q-SF is the eighth scale of the Q-LES-Q (Overall level of satisfaction) and it consists of fourteen items assessing satisfaction with his/ her physical health, social relations, ability to function in daily life, physical mobility, mood, family relations, sexual drive and interest, ability to perform hobbies, work, leisure activities, household activities, economic status, living/ housing situation, vision and overall wellbeing. Each of the 14 items is rated on a 5-point scale (1. very poor, 2. poor, 3. fair, 4. good, 5. very good) that indicates the degree of enjoyment or satisfaction experienced during the previous week. The total score from all 14 items theoretical range is 14–70. Higher scores on the Q-LES-Q-SF indicate greater contentment or satisfaction. The instrument also includes two additional items measuring satisfaction with medication and overall life satisfaction that are not included in the overall score. The Czech translation of the scale was taken over from the Academia Medica Pragensis – Amepra publication [15]. The scale items together with distribution parameters are provided in Tab. 3.
Tab. 3. The Q-LES-Q-SF item M, SD, Mo, and percentage of responses for each score (N = 1,301). Items are rated on a 5-point Likert scale 1. very poor, 2. poor, 3. fair, 4. good, 5. very good. 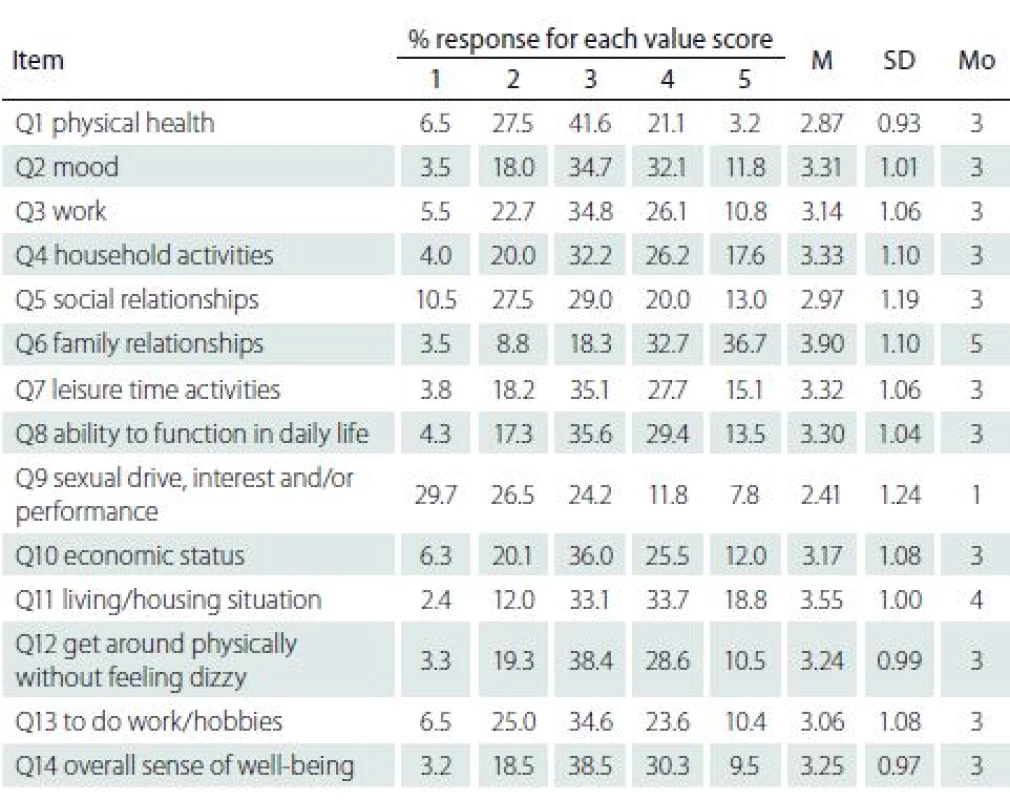
Q-LES-Q-SF – Quality of Life Enjoyment and Satisfaction Questionnaire short form; M – mean; Mo – modus; SD – standard deviation Analysis procedure
The psychometric parameters of the Q-LES--Q-SF were examined using the masters partial credit model, which enables exploration of variation of category ordering item-by-item [16] in Winsteps 4.1 computer software [17]. Prior to data analysis, the basic assumption of the Rasch model unidimensionality of the construct was tested using the parallel analysis procedure [18], the minimum average partial test [19], multiple group confirmatory factor analysis [20], and the Rasch principal components analysis of residuals [21]. Evidence of item fit and item difficulty, category functioning, person separation, reliability of person measures, targeting of persons and items, scale continuity, and differential item functioning of the Q-LES-Q-SF scale across gender, age, CGI, and effect of presence of somatic and psychiatric comorbidity were explored.
Results
Dimensionality of the Q-LES-Q-SF
We assessed unidimensionality of the questionnaire that is critical assumption [22] for the Rasch analysis via parallel analysis procedure, minimal average partial test, and also Hull method [23] using polychoric correlations as a dispersion matrix and minimum rank factor analysis for factor extraction. All analytic procedures were in complete agreement advising to retain one component, a single factor accounting for 50.4% of the variance and items loading between 0.52 and 0.83.
Construct replicability was assessed by H index [24], which evaluates how well a set of items represents a common factor. High H value 0.933 (> 0.80) and also the greatest lower bound (glb) [25] to reliability of 0.934 suggest that the quality of life construct was well defined and is likely to be stable across studies. The assessment was performed by programme FACTOR ver. 10.3.01 (Lorenzo-Seva & Ferrando) [26].
Multiple group confirmatory factor analysis [20], robust weighted least squares estimator (WLSMV), rotation geomin, parameterization theta, with ordinal factor indicators and a mean structure with between and within gender groups equalities, holding factor means constrained to zero, variance and the residual variances equal between groups, supported the idea of a one-factor solution, confirmatory fit index (CFI) = 0.969, tucker Lewis index (TLI) = 0.964, root mean square error of approximation (RMSEA) = 0.064, 90% CI (0.061–0.066).
The Rasch principal components analysis of residuals was used to examine whether a substantial factor existed in the residuals after the primary measurement dimension has been estimated [21,27]. The first principal component of residuals explained 49.0% of empirical variance which is very close to the model expected value (49.5%). The first contrast in the residuals explained 7.1% of the variance and the ratio of variance explained the measure of variance in the first contrast was 7 to 1. The eigenvalues of the unexplained variance in the first contrast was 1.93, which is less than the strength of two items.
The disattenuated correlation coefficients of person measures on item clusters loading on the five residuals components ranged from 0.74 to 1.0. The correlation of residuals of 0.19 between Item 8 (ability to function in daily life) and Item 12 (get around physically without feeling dizzy/ falling), and also the value of 0.30 between Item 10 (economic status) and Item 11 (living/ housing situation) suggest local item dependency, but the shared random variance is only 4% and 9%, resp.
The unexplained variance of the first contrast eigenvalues using repeated simulation studies based on three Rasch fitting datasets with same characteristics as our dataset ranged from 1.5 to 1.19, indicating that eigenvalues rescaled to match the number of items, may only approach value 2.0 by chance.
Category functioning analysis
We examined step calibrations or Rasch--Andrich thresholds (a 50% chance of an individual being scored in either category) that reflect distance between response categories on a 5-category (four thresholds) scale. It should be greater than 1.0 logit (log odd units, the natural logarithm of the odds ratio) to indicate distinct categories but 5.0 logit and more would suggest a gap in the variable [28]. The structure calibration thresholds progressed monotonically and the average Rasch-Andrich thresholds were –2.18, –0.64, 0.79, 2.05 indicating that there is no overlap in categories and they reflect the distance between the categories. It means that the highest areas of the probability distributions of each response category were never below either adjacent category. The differences between thresholds ranged from 1.26 to 1.53 logit in all items apart from Item 9 (thresholds –1.16, –0.54, 0.67, 1.04), and Item 6 (thresholds –1.31, –0.46, 0.31, 1.47).
Item fit and item difficulty
The items measured in units of logits arranged by decreasing difficulty reflecting their location on the Rasch scale are presented in Tab. 4. The term „difficulty“ means in this context probability of endorsing an item, e. g. low difficulty (logit) indicates that a respondent more often endorses the statement and has a higher level of quality of life. The values of the scale logits range from –0.84 to 1.07 and the value of 0 corresponds to 0.5 probability of confirming an item. The most difficult to endorse was Item 9 (sexual drive, interest and/ or performance) while the easiest was Item 6 (family relationships).
Tab. 4. Item fit statistics (Partial Rating Scale Model). 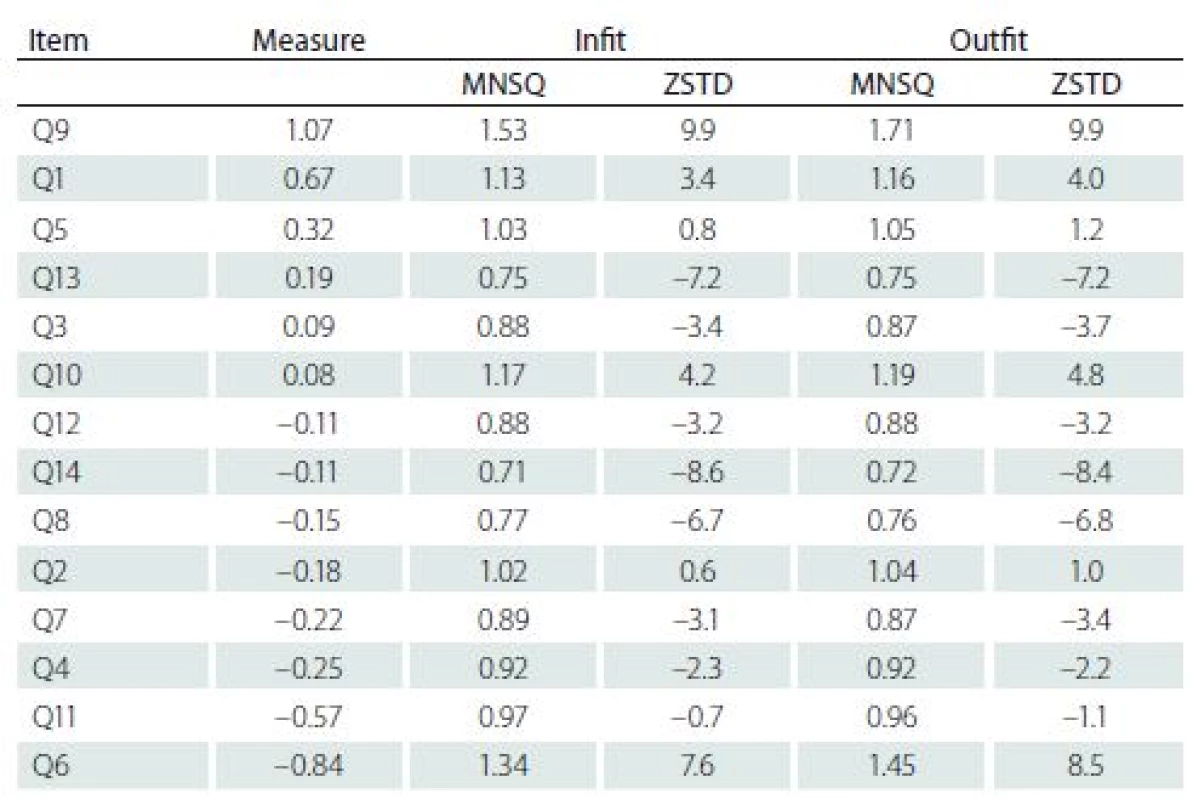
Measure – difficulty in logit; MNSQ – mean squares; ZSTD – z standardized scores The basic assumption of the Rasch model that high scorers endorse almost all easy items is assessed by mean-square (MNSQ) residual summary statistics which indicate the consistency of the response to an item with the sample responses to the other items [29]. There are two quantitative indicators of fit discrepancy in the Rasch model: Infit (the information-weighted average of the squared residuals) is sensitive to unexpected responses near the respondent level of quality of life, and Outfit (Pearson chi-square fit statistic divided by its degrees of freedom) reflects the difference between observed and expected responses ignoring the level of an attribute and is sensitive to outliers. Both MNSQs have expectation of 1.0 (the data fit the model exactly), and they range from zero to infinity. The MNSQ less than 1.0 indicates that the data are more predictable than the model expects (overfit), greater than 1.0 means that the data are less predictable than the model expects (underfit). According to Linacre [29] reasonable item MNSQ interval for scale Infit and Outfit is 0.6–1.4, and even the range of 1.0 ± 0.5 still indicates productive measurements. Corresponding to each MNSQ are z standardized scores (a unit-normal deviate) which are probability associated with H0: data fit the Rasch model, and the values outside of ± 1.96 indicate statistical significance [24,28–30]. The Infit and Outfit MNSQ ranged from 0.71 to 1.53 and from 0.72 to 1.71, resp. The MNSQ of all items were, apart from Item 2, 5 and 11, statistically significant. Considering the large sample, it is only to be expected. In this context the MNSQ values are more informative about the size of misfit [31,32]. The highest underfit was found with Item 9 and 6, where Outfit MNSQ indicates that there is 71% and 45% of randomness in the data than modelled, resp. The highest overfit MNSQ was detected with Items 8, 13, and 14 where the average MNSQ of 0.74 indicates a 26% deficiency in Rasch model predicted randomness.
Separation, reliability of person measures
The Rasch separation reliability coefficient (variance determined by the model divided by model variance plus residual variance) provides an assessment of how close model estimation values and the empirical values are located to each other. The lower and upper bounds were 0.88 and 0.91; and the person raw score to measure correlation was 0.98. It means that there is high probability that respondents assessed with high measures do have higher measures than persons estimated with low measures.
The Separation Ratio (G), an index comparing the „true“ spread of the measures with their measurement error, was 3.13. It indicates the measure of spread of this sample of examinees in units of the test error in their measures. There were 4.5 (4G+1)/ 3 discernible strata, which suggests at least four significantly different levels of measures in the functional range [32].
Targeting and scale continuity
Simultaneous positioning of items and person responses on a common logit scale permit the evaluation of overlap of persons and items [28,32]. The mean logit score of persons was 0.37 and the mean logit score of the items is by default zero representing the item of average difficulty for the scale. It means that the mean of persons in our sample has a 59.25% chance of being above the mean item threshold, i.e. the sample as a whole was located at a slightly higher level of wellbeing than the average of the scale.
Visual inspection of the Wright Map (Fig. 1) suggests almost symmetrical items-persons spread and absence of floor and ceiling effect (0.1% respondents achieved the lowest and 0.3% the highest possible score). The difference of less than 1.0 logit between person and the mean values of items suggests that the distributions of item thresholds and person estimates were relatively well matched and the scale is adequately targeted.
Fig. 1. Wright person-item map.
M – mean; S – 1SD from mean; T – 2SD from mean; SD – standard deviation each „*“ is 12; each „+“ is 1 to 11 persons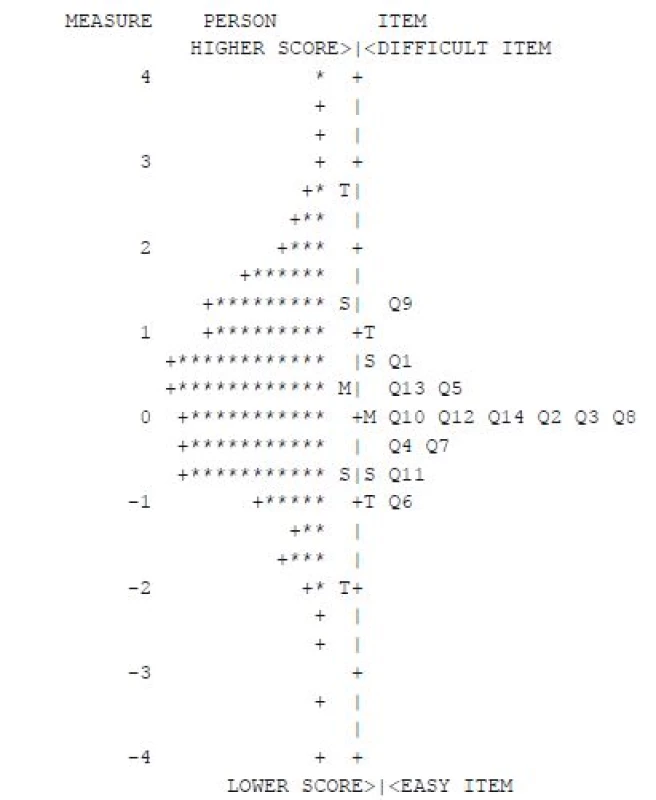
Differential item functioning
The fit of data to the model can also be affected when subgroups within the sample with equal level of the measured quality of life respond in a different manner to an individual item, which may decrease external validity of the scale.
We tested differential item functioning (DIF) to evaluate the stability of the Q-LES--Q-SF response pattern by gender, age, and CGI. The responses of subgroups to each item were compared, keeping all other items and person measures constant (Tab. 5). A hypothesis that the DIF size, apart from measurement error, is zero was evaluated by Mantel chi-square for polytomies with Bonferroni correction. However, as a statistical significance being dependent on sample size gives no indication of the actual impact on person measures, we considered the contrast as significant if the value was outside the value ± 0.5 logit [31,32]. This analysis found the DIF value of concern only for Item 9 (sexual drive, interest and/ or performance) between age subgroups (younger persons 0.60 logit, older persons 1.57 logit, DIF = –0.97 logit). However, the DIF impact on person measures also depends on the length of the test, and in this case is rather small (0.069).
Tab. 5. Differential Item Functioning (DIF). 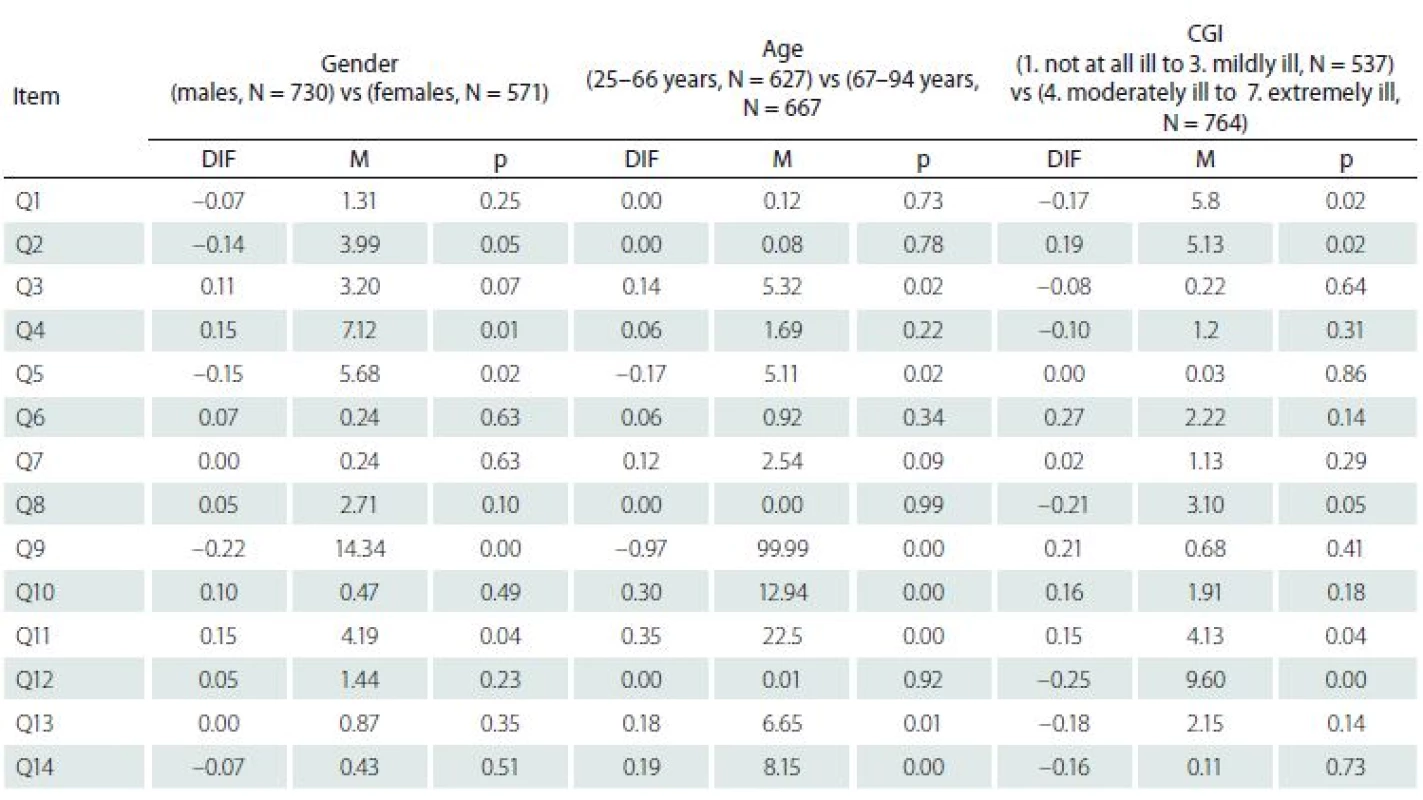
CGI – Clinical Global Impression; M – Mantel Chi² Percentile norms
Normative data (Tab. 6) are presented in the form of percentile ranks with accompanying credible intervals (Bayesian term for confidential interval). The percentile ranks were calculated using the formula [(n + 0.5x)/ N] × 100, where n is the number of members of the normative sample scoring below a given score, x is the number obtaining the given score, and N is the overall size of the normative sample [33,34]. It indicates the percentage of scores that fall below the score of interest, where half of those obtaining the score of interest are included in the percentage [35]. The credible intervals, which evaluate a 95% probability that the true percentile rank of the score obtained by the case lies within the stated interval, were assessed using standard Bayesian approach and, in contrast to classical test theory, do not capture effects of measurement error of an individual‘s score [36]. The percentile ranks less than 5 and greater than 95 are reported to one decimal place point to reduce noise introduced when calculating interval estimates for extreme scores [31].
Tab. 6. Q-LES-Q-SF percentile norms. 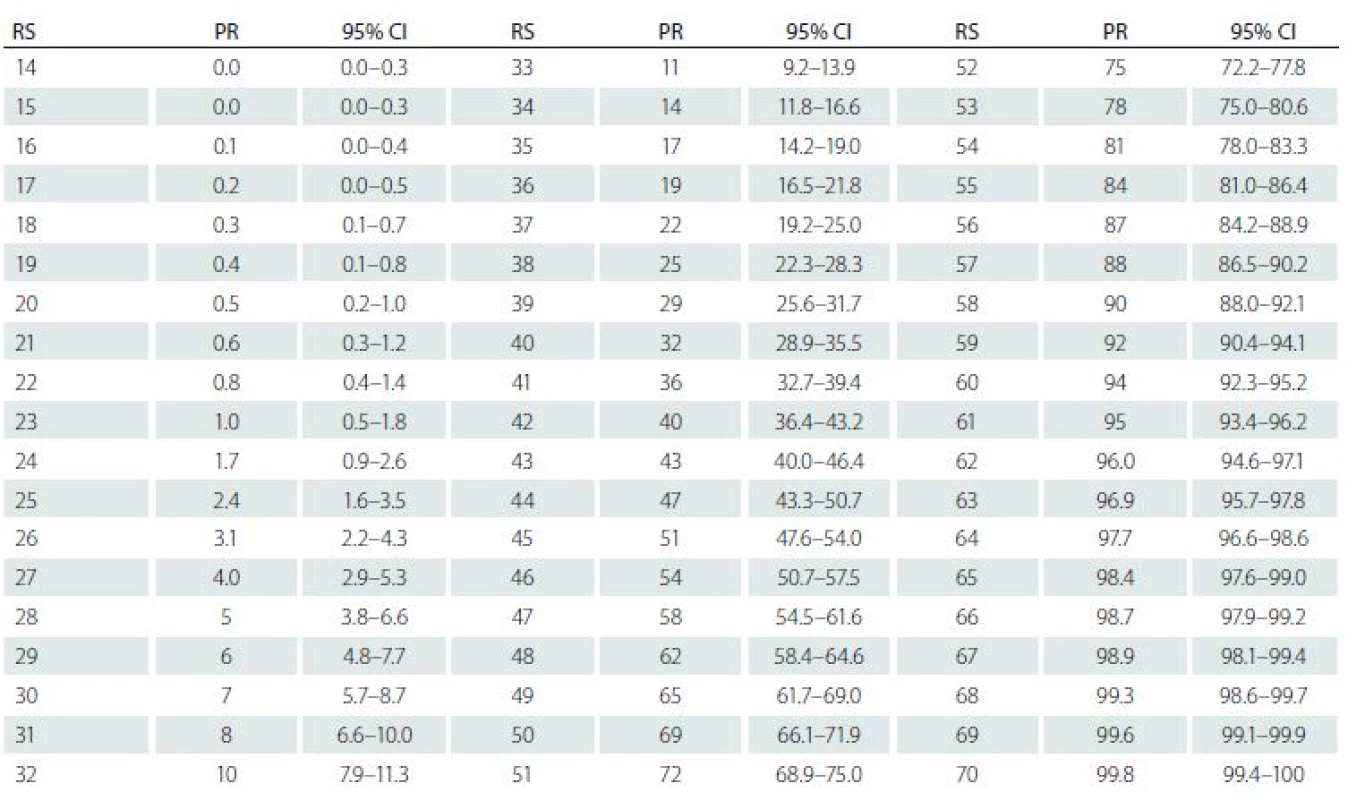
CI – confidence interval; PR – percentile rank; Q-LES-Q-SF – Quality of Life Enjoyment and Satisfaction Questionnaire short form; RS – raw score Discussion and conclusion
Our analysis of the Q-LES-Q-SF brought findings which reasonably support an approximate resemblance between the Rasch model and our data based on responses from a consecutive sample of pa-tients with neuropathy. The results supported the unidimensionality of the measure and the 5-point scale categories progressed monotonically without overlap, which ensures reasonable measurement stability. The values of the Rasch separation reliability and the separation ratio indicated that the construct „quality of life“ was adequately operationalised and satisfactorily meets discrimination requirements. There was no floor or ceiling effect found and comparison of the distribution of the person‘s level of wellbeing to the distribution of items difficulty on common logit scale being almost symmetrical indicates that the scale is sufficiently well targeted. The effect of differential item functioning was found only in the age and somatic comorbidity subgroups for Item 9 (sexual drive, interest and/ or performance) indicating that older patients are less satisfied with their sexual life.
The indicators of fit discrepancy imply that there are four items easy (Q4, Q7, Q11, Q6), four items difficult (Q13, Q5, Q1, Q9) to endorse, and six items (Q2, Q3, Q8, Q10, Q12, Q14) are on the same level of difficulty indicating the possibility of redundancy of items. The most problematic was Item 9 where the value of the Outfit MNSQ divulges the presence of about 71% of noise. It indicates that this part of a patient’s life might be notably unsatisfactory for them or that the wording of the item is for the respondents semantically ambiguous. Distribution of the Item 9 frequencies (Tab. 3) was markedly positively skewed. About 56% of patients reported satisfaction with their sexual life as very poor and poor and only 8% as very good. However, the Outfit MNSQ value of 1.71 is still considered acceptable for clinical observation and not degrading for measurement [28,32]. As a sexual life is an integral part of human life there is no substantial reason to exclude the item from the scale. Alternatively, it might be possible to consider adjustment of the item wording in order to reduce its possible equivocality.
As Linacre and Tennant observed [21] in practice data hardly ever conform exactly to the Rasch model specifications, and some departure can be almost always expected. Nevertheless, our analysis brought acceptable evidence of resemblance between the theoretical expectations of the Rasch model and our data. The conclusions are limited by the consecutive selection of patients and the lack of detailed specification of diagnosis.
The study was carried out under the COSMOS project and sponsored by Krka ČR, s.r.o.
The authors declare they have no potential conflicts of interest concerning drugs, products, or services used in the study.
The Editorial Board declares that the manuscript met the ICMJE “uniform requirements” for biomedical papers.
prof. PhDr. Jiří Kožený, CSc.
National Institute of Mental Health
Topolová 748
250 67 Klecany
Czech Republic
e-mail: jiri.kozeny@nudz.cz
Accepted for review: 21. 8. 2018
Accepted for print: 20. 11. 2018
Zdroje
1. Pietersma S, van den Akker-van Marle ME, de Vries M. Generic quality of life utility measures in health-care research: conceptual issues highlighted for the most commonly used utility measures. Int J Wellbeing 2013; 3(2): 173–181. doi: 10.5502/ ijw.v3i2.4.
2. Chen TH, Li L, Kochen MM. A systematic review: how to choose appropriate health-related quality of life (HRQOL) measures in routine general practice? J Zhejiang Univ Sci B 2005; 6(9): 936–940. doi: 10.1631/ jzus.2005.B0936.
3. Lu G, Brazier JE, Ades AE. Mapping from disease-specific to generic health-related quality-of-life scales: a common factor model. Value Health 2013; 16(1): 177–184. doi: 10.1016/ j.jval.2012.07.003.
4. Petrillo J, Cano SJ, McLeod LD et al. Using classical test theory, item response theory, and Rasch measurement theory to evaluate patient-reported outcome measures: a comparison of worked examples. Value Health 2015; 18(1): 25–34. doi: 10.1016/ j.jval.2014.10.005.
5. Mick E, Faraone SV, Spencer T et al. Assessing the validity of the Quality of Life Enjoyment and Satisfaction Questionnaire – short form in adults with ADHD. J Atten Disord 2008; 11(4): 504–509. doi: 10.1177/ 1087054707308468.
6. Wyrwich KW, Harnam N, Revicki DA et al. Assessment of Quality of Life Enjoyment and Satisfaction Questionnaire – short form responder thresholds in generalized anxiety disorder and bipolar disorder studies. Int Clin Psychopharmacol 2011; 26(3): 121–129. doi: 10.1097/ YIC.0b013e3283427cd7.
7. Stevanovic D. Quality of Life Enjoyment and Satisfaction Questionnaire – short form for quality of life assessments in clinical practice: a psychometric study. J Psychiatr Ment Health Nurs 2011; 18(8): 744–750. doi: 10.1111/ j.1365-2850.2011.01735.x.
8. Lee YT, Liu SI, Huang HC et al. Validity and reliability of the Chinese version of the short form of Quality of Life Enjoyment and Satisfaction Questionnaire (Q-LES-Q-SF). Qual Life Res 2014; 23(3): 907–916. doi: 10.1007/ s11136-013-0528-0.
9. Bourion-Bédès S, Schwan R, Epstein J et al. Combination of classical test theory (CTT) and item response theory (IRT) analysis to study the psychometric properties of the French version of the Quality of Life Enjoyment and Satisfaction Questionnaire – short form (Q-LES-Q-SF). Qual Life Res 2015; 24(2): 287–293. doi: 10.1007/ s11136-014-0772-y.
10. Bourion-Bédès S, Schwan S, Laprevote V et al. Differential item functioning (DIF) of SF-12 and Q-LES-Q-SF items among french substance users. Health Qual Life Outcomes 2015; 13 : 172. doi: 10.1186/ s12955-015-0365-7.
11. Hambleton KH, Russell W. Jones. An NCME instructional module on: comparison of classical test theory and item response theory and their applications to test development. Educ Meas 1993; 12(3): 38–47. doi: 10.1111/ j.1745-3992.1993.tb00543.x.
12. ICD-10 Version: 2016. [online]. Available from: http:/ / apps.who.int/ classifications/ icd10/ browse/ 2016/ en.
13. Freynhagen R, Baron R, Gockel U et al. PainDETECT: a new screening questionnaire to identify neuropathic components in patients with back pain. Curr Med Res Opin 2006; 22(10): 1911–1920.
14. Endicott J, Nee J, Harrison W et al. Quality of Life Enjoyment and Satisfaction Questionnaire: a new measure. Psychopharmacol Bull 1993; 29(2): 321–326.
15. Dotazník kvality života (Q-LES-Q): kvalita prožívání radosti a spokojenosti ze života: informace pro terapeuta. Praha: Academia Medica Pragensis – Amepra 2003.
16. De Ayala RJ. The theory and practice of item response theory. New York: The Guilford Press 2009.
17. Linacre JM. Winsteps® Rasch measurement computer program. User‘s Guide. [online]. Available from: www.winsteps.com/ winman/ copyright.htm.
18. Velicer WF. Determining the number of components from the matrix of partial correlations. Psychometrika 1976; 41(3): 321–327.
19. Timmerman ME, Lorenzo-Seva U. Dimensionality assessment of ordered polytomous items with parallel analysis. Psychol Methods 2011; 16(2): 209–220. doi: 10.1037/ a0023353.
20. Muthén LK, Muthén BO. Mplus user’s guide: statistical analysis with latent variables. 7th ed. Los Angeles: CA Muthén & Muthén 1998–2012.
21. Linacre JM, Tennant A. More about critical eigenvalue sizes (variances) in standardized-residual principal components analysis (PCA). Rasch Meas Transact 2009; 23(3): 1228.
22. Tennant A, Pallant JF. Unidimensionality matters! Rasch Meas Transact 2006; 20(1): 1048–1051.
23. Lorenzo-Seva U, Timmerman ME, Kiers HA. The Hull method for selecting the number of common factors. Multivariate Behav Res 2011; 46(2): 340–364. doi: 10.1080/ 00273171.2011.564527.
24. Fischer GH, Molenaar IW (eds). Rasch models: foundations, recent developments, and applications. New York: Springer Science & Business Media 2012.
25. ten Berge JM, Snijders TA, Zegers FE. Computational aspects of the greatest lower bound to the reliability and constrained minimum trace factor analysis. Psychometrika 1981; 46(2): 201–213.
26. Lorenzo-Seva U, Ferrando PJ. FACTOR 9.2. A comprehensive program for fitting exploratory and semiconfirmatory factor analysis and IRT models. Appl Psych Meas 2013; 37 : 497–498. doi: 10.1177/ 0146621613487794.
27. Raîche G. Critical eigenvalue sizes (Variances) in standardized residual Principal Components Analysis. Rasch Meas Transact 2005; 19(1): 1012.
28. Linacre JM. Optimizing rating scale category effectiveness. J Appl Meas 2002; 3(1): 85–106.
29. Linacre JM. Item Discrimination and Rasch-Andrich thresholds. Rasch Meas Transact 2006; 20(1): 1054.
30. Smith EV. Detecting and evaluating the impact of multidimensionality using item fit statistics and principal component analysis of residuals. J Appl Meas 2002; 3(2): 205–231.
31. Wright BD, Linacre JM. Reasonable mean-square fit values. Rasch Meas Transact 1994; 8(3): 370.
32. Gustafson JE. Testing and obtaining fit of data to the Rasch model. Br J Math Stat Psychol 1980; 33(2): 220. doi: 10.1111/ j.2044-8317.1980.tb00609.x.
33. Crawford JR, Garthwaite PH. Comparison of a single case to a control or normative sample in neuropsychology: development of a Bayesian approach.Cogn Neuropsychol 2007; 24(4): 343–372. doi: 10.1080/ 02643290701290146.
34. Crawford JR, Garthwaite PH, Slick DJ. On percentile norms in neuropsychology: proposed reporting standards and methods for quantifying the uncertainty over the percentile ranks of test scores. Clin Neuropsychol 2009; 23(7): 1173–1195. doi: 10.1080/ 13854040902795018.
35. Solomon SR, Sawilowsky SS. Impact of rank-based normalizing transformations on the accuracy of test scores. J Mod Appl Stat Meth 2009; 8(2): 448–462.
36. Crawford JR, Garthwaite PH. On the „optimal“ size for normative samples in neuropsychology: capturing the uncertainty when normative data are used to quantify the standing of a neuropsychological test score. Child Neuropsychol 2008; 14(2): 99–117. doi: 10.1080/ 09297040801894709.Štítky
Detská neurológia Neurochirurgia Neurológia
Článok vyšiel v časopiseČeská a slovenská neurologie a neurochirurgie
Najčítanejšie tento týždeň
2019 Číslo 1- Metamizol jako analgetikum první volby: kdy, pro koho, jak a proč?
- Kombinace metamizol/paracetamol v léčbě pooperační bolesti u zákroků v rámci jednodenní chirurgie
- Neuromultivit v terapii neuropatií, neuritid a neuralgií u dospělých pacientů
- Antidepresivní efekt kombinovaného analgetika tramadolu s paracetamolem
-
Všetky články tohto čísla
- Genetics of neurodegenerative dementias in ten points – what can a neurologist expect from molecular genetics?
- Mild traumatic brain injury management – consensus statement of the Czech Neurological Society CMS JEP
- Analýza dat v neurologii LXXIII. Problematika interpretace Pearsonova korelačního koeficientu
- Can we accurately diagnose the dyskinetic form of cerebral palsy? YES
- Umíme dobře diagnostikovat dyskinetickou formu DMO? NE
- Umíme dobře diagnostikovat dyskinetickou formu DMO?
- Sub signum coma – current view of chronic disorders of consciousness
- Chronic subdural haematoma
- Editorial
- Iatrogenesis of patients with psychogenic non-epileptic seizures – possible solutions
- Praktické užití a indikace transkraniální stimulace stejnosměrným proudem
- Poděkování recenzentům
- Transcranial magnetic stimulation in borderline personality disorder – case series
- TNFα and microRNA-15b expression changes in experimental model of subarachnoid haemorrhage
- A Rasch analysis of the Q-LES-Q-SF questionnaire in a cohort of patients with neuropathic pain
- Oligoclonal IgG and free light chains – comparison between agarose and polyacrylamide isoelectric focusing
- Contact heat evoked potentials – impact of physiological variables
- Ketogenic diet – effective treatment of childhood and adolescent epilepsies
- Laboratory efficacy testing of acetylsalicylic acid treatment in secondary prevention of ischemic stroke
- Magnetic resonance imaging showing parietal atrophy of the brain in late-onset Alzheimer’s disease
- New possibilities of ultrasound in predicting low back pain in adolescent males – pilot study
- Česká a slovenská neurologie a neurochirurgie
- Archív čísel
- Aktuálne číslo
- Informácie o časopise
Najčítanejšie v tomto čísle- Mild traumatic brain injury management – consensus statement of the Czech Neurological Society CMS JEP
- Chronic subdural haematoma
- Oligoclonal IgG and free light chains – comparison between agarose and polyacrylamide isoelectric focusing
- Ketogenic diet – effective treatment of childhood and adolescent epilepsies
Prihlásenie#ADS_BOTTOM_SCRIPTS#Zabudnuté hesloZadajte e-mailovú adresu, s ktorou ste vytvárali účet. Budú Vám na ňu zasielané informácie k nastaveniu nového hesla.
- Časopisy


