De novo non-alcoholic fatty liver disease after liver transplantation – as diagnosed by magnetic resonance
De novo nealkoholová tuková choroba pečene po transplantácii pečene – diagnostikovaná pomocou magnetickej rezonancie
Východiská: Nealkoholová tuková choroba pečene (NAFLD) je jednou z najčastejších príčin chronického ochorenia pečene a zároveň indikácií transplantácie pečene (LTx). NAFLD, ktorá vznikne po LTx pre inú indikáciu sa nazýva de novo NAFLD.
Cieľ: Určiť výskyt de novo NAFLD za pomoci diagnostiky magnetickej rezonančnej (MR) spektroskopie (MRS).
Metódy: Prospektívna analýza údajov za sebou idúcich pacientov po LTx v intervale medzi januárom 2015 a decembrom 2019. Do štúdie boli zaradení pacienti transplantovaní pre cirhózu pečene na podklade inej etiológie ako NAFLD. Vylúčení boli pacienti po LTx pre NAFLD, so závažnými komplikáciami < 2 mesiace po LTx a tý, ktorí zomreli < 3 mesiace po LTx. Sledovali sme demografické a antropometrické charakteristiky, laboratórne parametre potrebné na výpočet indexu tuku v pečeni (FLI – fatty liver index) a MRS v mesiacoch 3, 6, 12, 24 po LTx. NAFLD bola diagnostikovaná pri FLI ≥ 60 a pri MRS obsah tuku v pečeni ≥ 5%
Výsledky: V sledovanom intervale bolo vykonaných 164 LTx u 153 pacientov, vylúčili sme 6 pacientov (4 %) po LTx pre NAFLD a 52 pacientov (34 %) podľa vopred stanovených kritérií. Do definitívnej analýzy sme zaradili 95 pacientov (62 %), s vekom 50,4 rokov (18–70), 38 % žien, s MELD (model for end stage liver disease) 15,7 bodov, s Child-Pugh skóre 8,9 bodov.
Etiológia: Alkoholová choroba pečene 44 pacientov ( 46 %), primárna sklerotizujúca cholangitída 16 (17 %), autoimunitné ochorenia 12 (13 %), rôzne 8 (9 %), hepatocelulárny karcinóm 7 (7 %), vírusové hepatitídy 3 (3 %), sekundárna biliárna cholangitída 3 (3 %), Wilsonova choroba 2 (2 %). Body mass index (BMI) kg/ m2, v čase LTx, mesiace 3, 6, 12 : 25,76; 24,6; 24,95; 26,5 (p < 0,01); FLI (mesiace 3, 6, 12, 24): 48,663 ± 5,878; 51,628 ± 6,166; 50,901 ± 7,075; 55,211 ± 13,832; MRS (> 5 % tuku, mesiace 6, 12, 24): 26,5; 32,1; 42,9 (p = 0,368); MRS (% tuku, medián, mesiace 6, 12, 24): 3,45; 4 (p = 0,045); 5 (p = 0,08). MR elastografia (≥ 2,88 kPa, mesiace 6, 12, 24): 26,8; 29,6 (p = 0,07); 46,2 (p = 0,1).
Záver: V sledovanej kohorte sme identifikovali so stúpajúcim trendom BMI zároveň vzostup obsahu Etiology po LTx. Šesť mesiacov po LTx sme pomocou MRS detegovali viac ako 5 % tuku v pečeni u 1/4 pacientov. V čase 6 a 12 mesiacov po LTx bola fibróza prítomná u 26 a 29 % pacientov. Klinický význam zatiaľ nepoznáme.
Klíčová slova:
transplantácia pečene – FLI – MR spektroskopia – MR elastografia – de novo NAFLD
Authors:
Skladaný Ľ. 1; Adamcova-Selcanova S. 1; Ciefova J. 1; Bystrianska N. 1; Skvarkova B. 1; Bachova B. 1; Koller T. 2
Authors‘ workplace:
HEGITO – Hepatology, Gastroenterology and Liver Transplantation Division of the Department of Internal Medicine II, Faculty of Medicine, Slovak Medical University, F. D. Roosevelt Hospital, Banska Bystrica, Slovakia
1; 5th Department of Internal Medicine, Comenius University Faculty of Medicine, University Hospital Bratislava Ruzinov, Bratislava, Slovakia
2
Published in:
Gastroent Hepatol 2020; 74(2): 116-122
Category:
Hepatology: original article
doi:
https://doi.org/10.14735/amgh2020116
Overview
Background: Non-alcoholic fatty liver disease (NAFLD) is one of the most common causes of and indications for chronic liver disease and liver transplant (LTx). NAFLD arising after LTx for another indication is called de novo NAFLD.
Aim: To determine the incidence of de novo NAFLD as diagnosed by magnetic resonance imaging (MRI) spectroscopy (MRS).
Methods: Prospective data analysis of consecutive patients (pts) after LTx. The study interval was from January 2015 to December 2019. We included pts transplanted for cirrhosis of non-NAFLD aetiology, excluded pts after LTx for NAFLD, severe complications < 2 months after LTx, who died < 3 months after LTx. We recorded demographic and anthropometric characteristics, laboratory panel (FLI – fatty liver index) and MRS at months 3, 6, 12, 24 after LTx. NAFLD was defined as FLI ≥ 60; MRS fat content ≥ 5%.
Results: During the study interval we performed 164 LTx in 153 pts, excluded 6 pts (4%) with NAFLD and 52 pts (34%) for pre-defined criteria. We included 95 pts (62%), aged 50.4 years (18–70), 38% women, MELD (model for end-stage liver disease) 15.7 points, Child-Pugh score 8.9 points.
Etiology: Alcohol-associated liver disease 44 pts (46%), primary sclerosing cholangitis 16 (17%), autoimmune diseases 12 (13%), miscellaneous 8 (9%), hepatocellular carcinoma 7 (7%), viral hepatitis 3 (3%), secondary biliary cholangitis 3 (3%), Wilson’s disease 2 (2%). Body mass index (BMI) (kg/ m2, at baseline, months 3, 6, 12): 25.76; 24.6; 24.95; 26.5 (P < 0.01); FLI (months 3, 6, 12, 24): 48.663 ± 5.878; 51.628 ± 6.166; 50.901 ± 7.075; 55.211 ± 13.832, MRS (> 5% fat, months 6, 12, 24): 26.5; 32.1; 42.9 (P = 0.368), MRS (% fat, median, months 6, 12, 24): 3.45; 4 (P = 0.045), 5 (P = 0.08). MRI elastography (≥ 2.88 kPa, months 6, 12, 24): 26.8; 29.6 (P = 0.07); 46.2 (P = 0.1). Conclusion: We identified rising liver fat content and BMI over time after LTx. Six months after LTx, MRS detected liver fat > 5% in 1/ 4 of the pts. Six and 12 months after LTx, fibrosis was present in 26 and 29% of the pts, resp. The clinical impact is not known.
Keywords:
liver transplantation – FLI – MRI spectroscopy – MRI elastography – de novo-NAFLD
Introduction
The prevalence of non-alcoholic fatty liver disease (NAFLD) is increasing in parallel with the epidemics of global obesity and diabetes in so far as, with an estimated prevalence of 10–40%, NAFLD is currently one of the most common causes of chronic liver disease [1,2]. Its more progressive form – NASH (non-alcoholic steatohepatitis) – can lead to advanced chronic liver disease (ACLD) and hepatocellular carcinoma (HCC), which are the most sharply increasing indications for liver transplantation (LTx) [1,3–5]. Additionally, NAFLD may arise after LTx preformed for another indication when we talk about de novo NAFLD.
Recurrence of NAFLD after LTX
Following LTx, the use of immunosuppressant drugs such as corticosteroids, calcineurin inhibitors and mammalian target of rapamycin inhibitors is known to significantly impact the metabolic balance and is associated with the development of insulin resistance, diabetes, hypertension, obesity and hyperlipidaemia [6–8]. Many post-transplant patients (pts) fulfill the criteria for the metabolic syndrome with NAFLD recurrence after LTx [9]. The recurrence rates for hepatic steatosis and steatohepatitis 5 years after the LTx are reported as ranging from 10 to 100% and from 4 to 28%, resp. [10–12]. NAFLD was identified in 30–60% of the pts between 1–5 years after LTx in the study by Yalamanchili et al. [10], but the Contos study reported up to 100% of NAFLD recurrence 5 years after LTx [11]. In IKEM, the Czech transplant centre, NAFLD was detected by liver biopsy in 30% of the pts 1 year and in 48% of the pts 10 years, resp. after LTx [13]. One risk involved in NAFLD recurrence is the development of liver fibrosis. According to literature, significant fibrosis ≥ F2 by METAVIR occurs in 0–33% of patients with NAFLD recurrence within one year [12,14].
De novo NAFLD after LTx
There are only a few studies characterising de novo NAFLD (NAFLD after LTx in pts who underwent transplantation for indications other than NASH) [15–17]. The risk factors for de novo NAFLD are inactivity, diet, obesity, dyslipidaemia, diabetes mellitus (DM), arterial hypertension, tacrolimus treatment, alcoholic cirrhosis as an indication for LTx, and donor graft steatosis [16–18]. The incidence of de novo NAFLD ranges from 9 to 48.3%, with the progression to fibrosis and cirrhosis in 20–40% of the pts [15–17]. In some patients, coexisting NAFLD/ NASH could remain undiagnosed before LTx, thus their de novo NAFLD could actually be a recurrence. Even if NAFLD after LTx does not progress to ACLD, the patients are at an increased risk of cardiovascular and renal morbidity and mortality [14,19].
Diagnosis of NAFLD after LTx
Despite the clear need for non-invasive diagnostic tools, liver biopsy remains the gold standard for the diagnosis of NAFLD/ NASH before and after LTx. The most frequently used and most accurate methods for non-invasive diagnosis of NAFLD are fatty liver index (FLI) and magnetic resonance spectroscopy (MRS) with sensitivity and specificity of web FLI calculator [20] from 92 to 100% [21–24]. In addition to its diagnostic accuracy, the advantage of MRS is the ability to perform magnetic resonance elastography (MRE) with sensitivity and specificity of almost 100% [25–28].
Aim
We aimed to determine the incidence of de novo NAFLD in pts after LTx at a single Transplant Centre (TC).
Methods
In this prospective study, we analysed the data of consecutive patients from the Hospital Information System „Care Center®“, and the Liver Transplant Database. We enrolled patients transplanted for cirrhosis of non-NAFLD aetiology during the interval from January 2015 to December 2019. We excluded those pts who had LTx performed for NASH, who died during the first 3 months after LTx, or who had severe complications up to 2 months after LTx. We recorded the demographics (age, sex), anthropometrics (height, weight, waist circumference, BMI (body mass index) in kg/ m2, laboratory (gama-glutamyltransferase, triacylglycerides and calculated FLI, MELD, Child-Turcootte-Pugh score (CTPS)), and imaging variables (magnetic resonance imaging (MRI) – MRS and MRE) in the Jessenius Diagnostic Centre, Ltd., Nitra. The measurements were taken at months 3, 6, 12, 24 after LTx. FLI was interpreted as supportive of the diagnosis of NAFLD, if ≥ 60 [20]. The interpretation of the MRS was supportive of NAFLD if it was ≥ 5%, and the MRE of significant fibrosis if it was ≥ 2.88 kPa. For statistical analysis, we used legally obtained Wizard software. We give the results of continuous variables as median and interquartile range results for the proportions as the numbers of cases and percentages. A comparison of the continuous variables was carried out using the Mann-Whitney test, and the chi-square test was used to compare the proportions. We defined the statistical significance by the probability of null-hypothesis inferior to 0.05. All the participants signed an informed consent before LTx and agreed with the data publication.
Results
During the study interval of 59 months, 164 LTx were performed in 153 pts. We excluded 6 pts (4%) transplanted for NAFLD and 52 (34%) for other pre-defined criteria. We included 95 pts (62%) with a median age of 50.4 years (18–70), 38% women, the median MELD was 15.7 points (7–34), and CTPS 8.9 points (5–14), (Scheme). The etiologies of ACLD before LTx were alcohol-associated liver disease in 44 pts (46%), primary sclerosing cholangitis in 16 (17%), autoimmune hepatitis and primary biliary cholangitis in 12 (13%), miscellaneous in 8 (9%), HCC in 7 (7%), viral hepatitis in 3 (3%), secondary biliary cholangitis in 3 (3%), and Wilson’s Disease in 2 (2%) (Graph 1). Summary statistics and study group characteristics are displayed in Tab. 1. The evolution of BMI (as measured at baseline, and at months 3, 6 and 12) was as follows: 25.76 (kg/ m2), 24.6, 24.95, 26.5 (P < 0.01) (Tab. 2 and Fig. 1).
Schéma 1. Analýza kohorty.

Tab. 1. Základné charakteristiky.
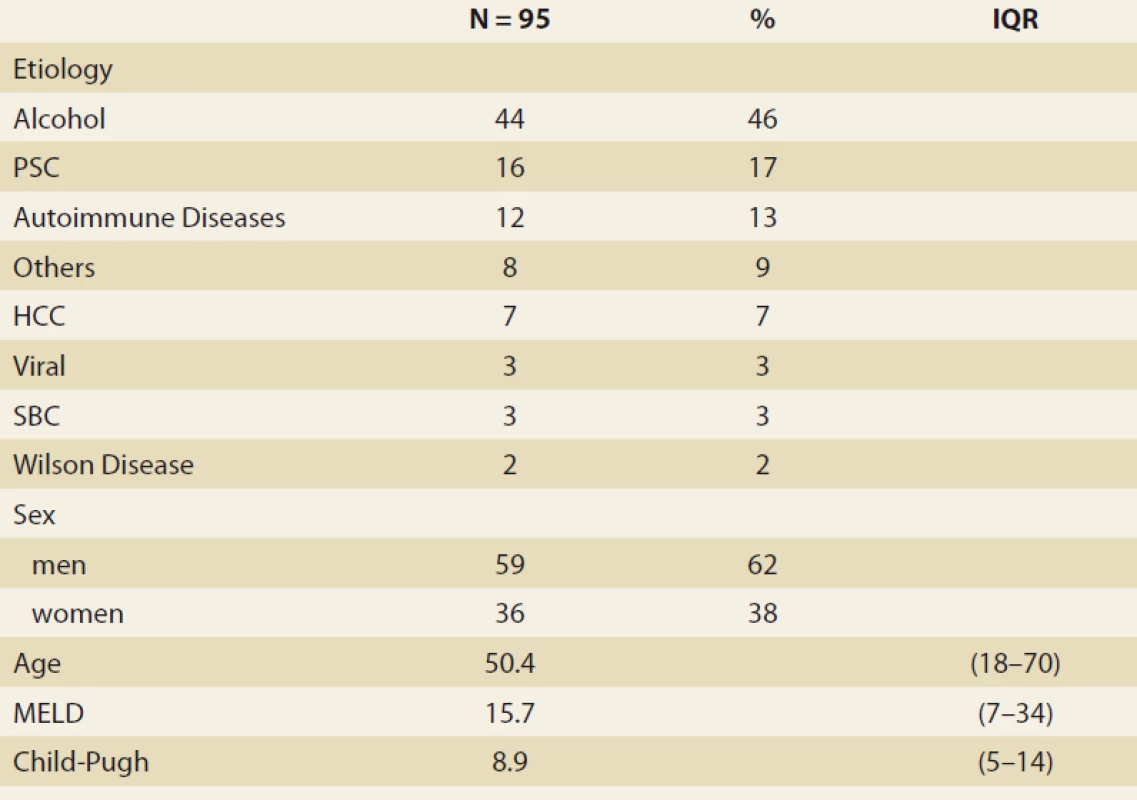
Graf 1. Etiológia pokročilého chronického
ochorenia pečene pred transplantáciou
pečene.

Tab. 2. Štatistická analýza:
index telesnej hmotnosti v čase.
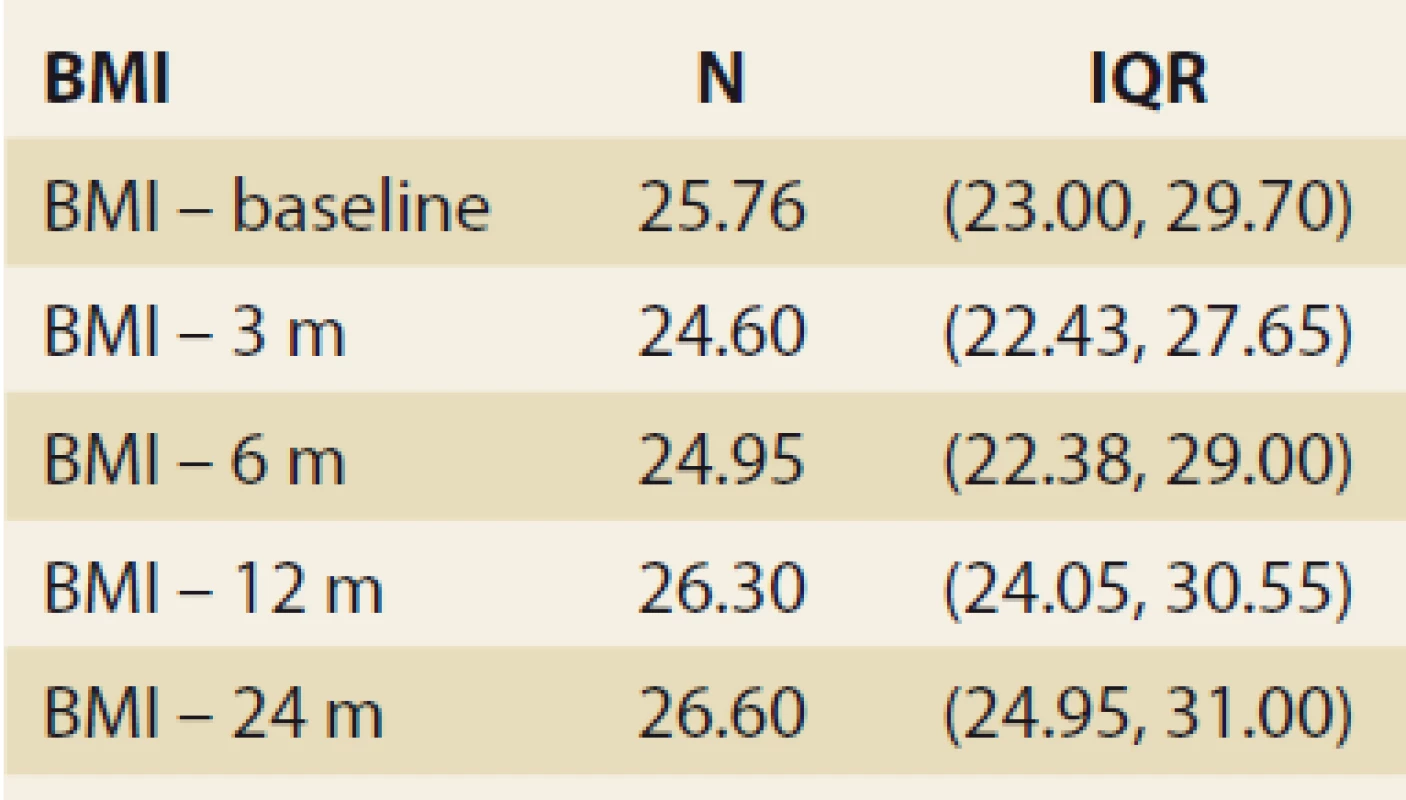
Obr. 1. Hodnoty indexu telesnej hmotnosti v čase, medián a IQR, p = 0,023.
The diagnosis of de novo NAFLD
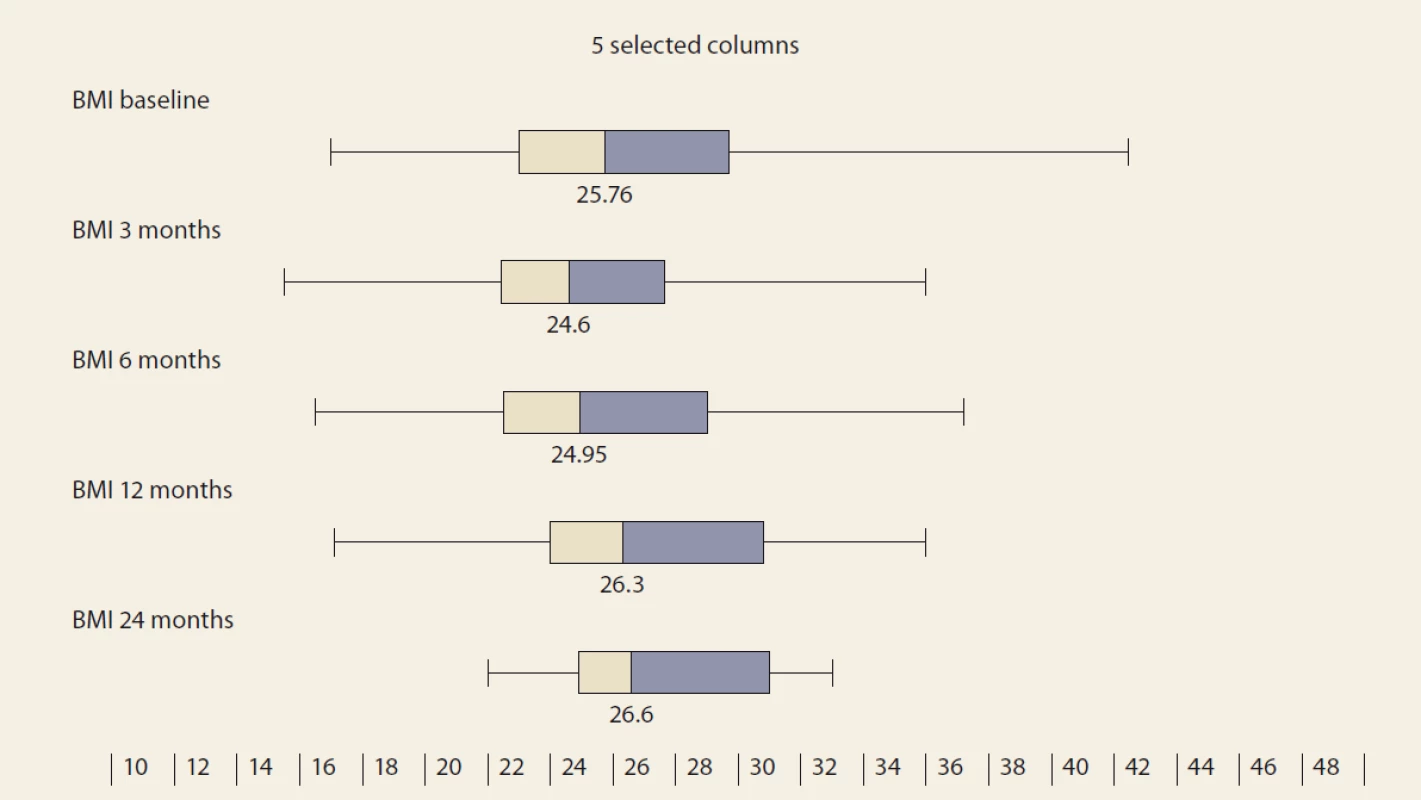
The FLI, suggestive of de novo NAFLD (as calculated at months 3, 6, 12 and 24 after LTx) was found in 39%, 38%, 42% and 53% of the pts. The median FLI results in these time periods increased, but did not differ significantly (48.663 ± 5.878, 51.628 ± 6.166, 50.901 ± 7.075 and 55.211 ± 13.832 (P = NS) (Tab. 3 and Fig. 1).
Tab. 3. Štatistická analýza – index tuku pečene v čase.

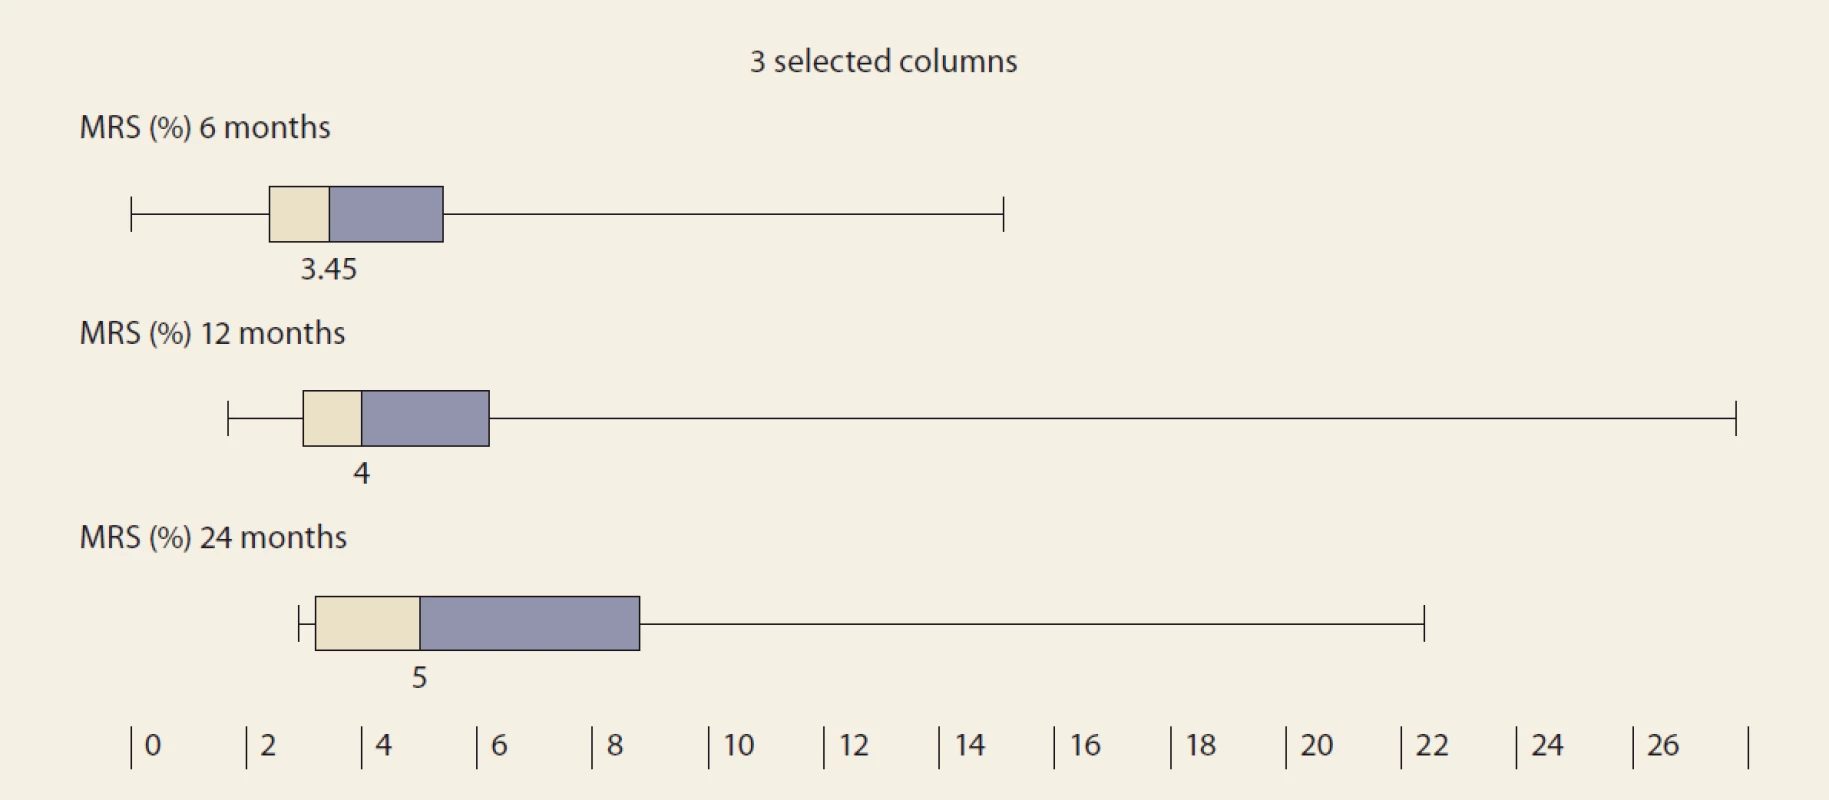
De novo NAFLD, as diagnosed by MRS at months 6, 12 and 24, was present in: 26.5%, 32.1% and 42.9% of the pts (P = 0.368). We observed a significant rise in the liver fat content by MRS, measured at months 6, 12 and 24 : 3.45, 4 and 5 (P = 0.045 and P = 0.08, resp.) (Tab. 4 and Fig. 3).
Tab. 4. Štatistická analýza – MR spektroskopia v čase.

Obr. 2. Hodnoty indexu tuku pečene v čase – priemerná hodnota SD, p = NS.
Obr. 3. MR spektroskopia (%) v čase – medián a IQR, 6 oproti 12 mesiacom, p = 0,045; 12 vs. 24 mesiacov, p = 0.08.
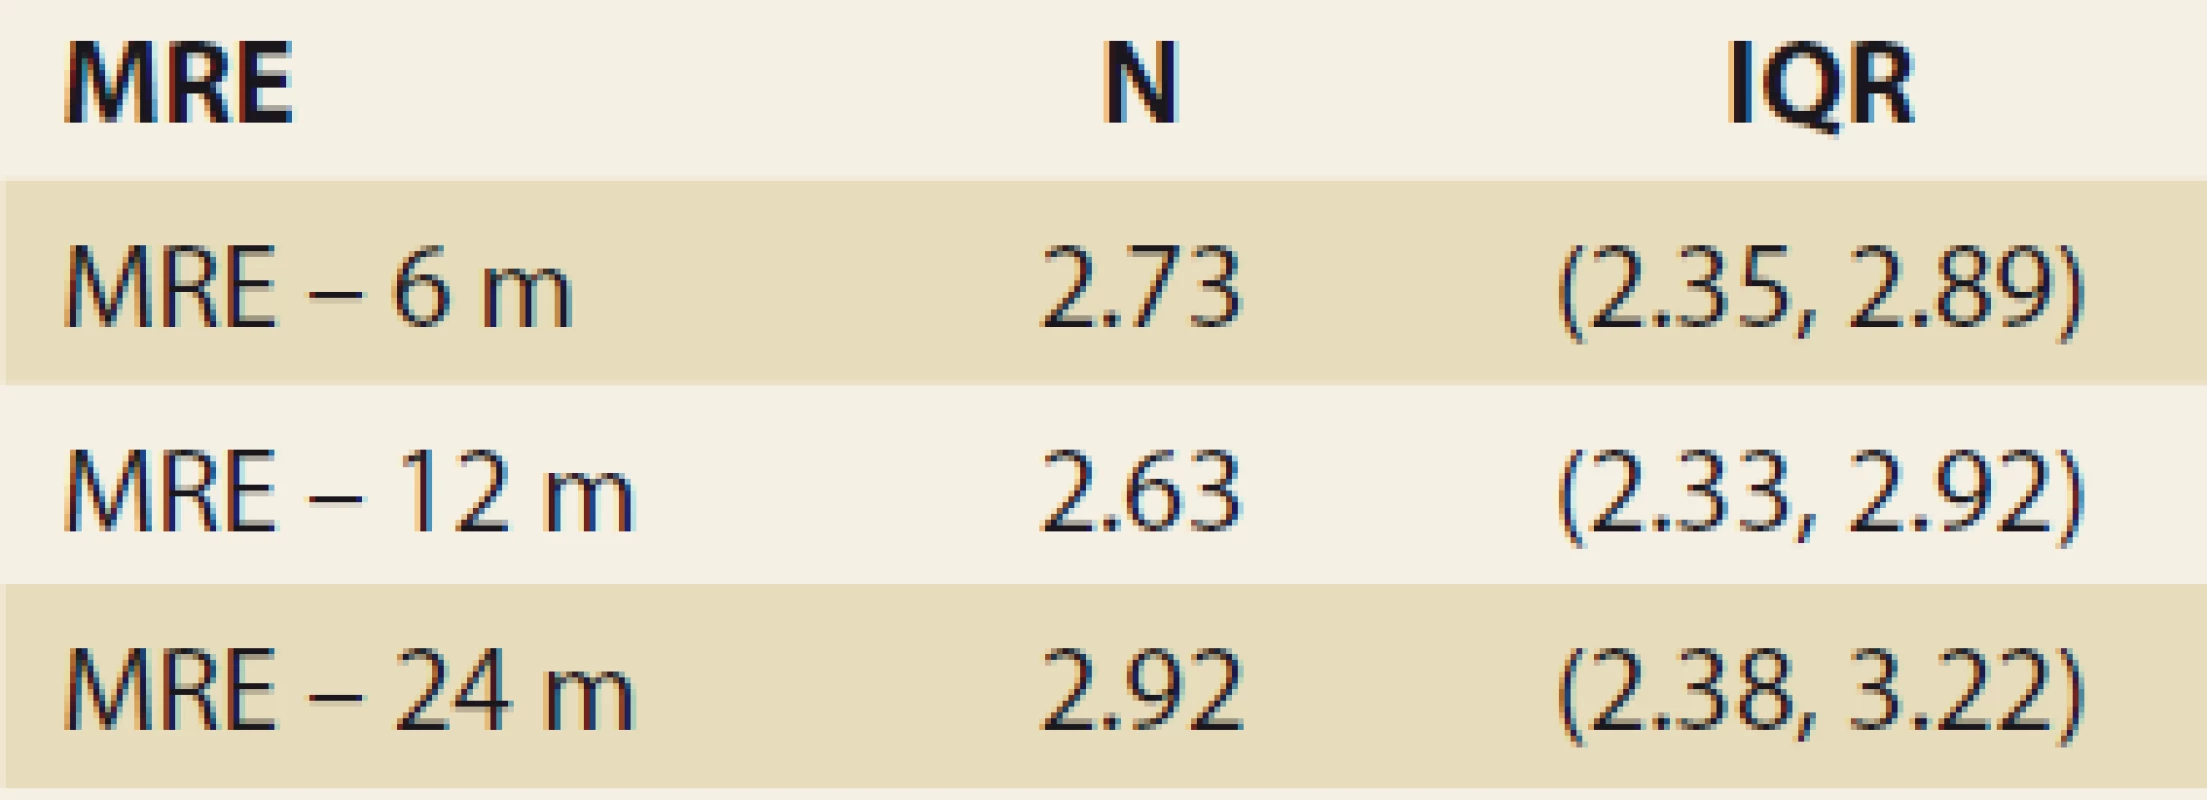
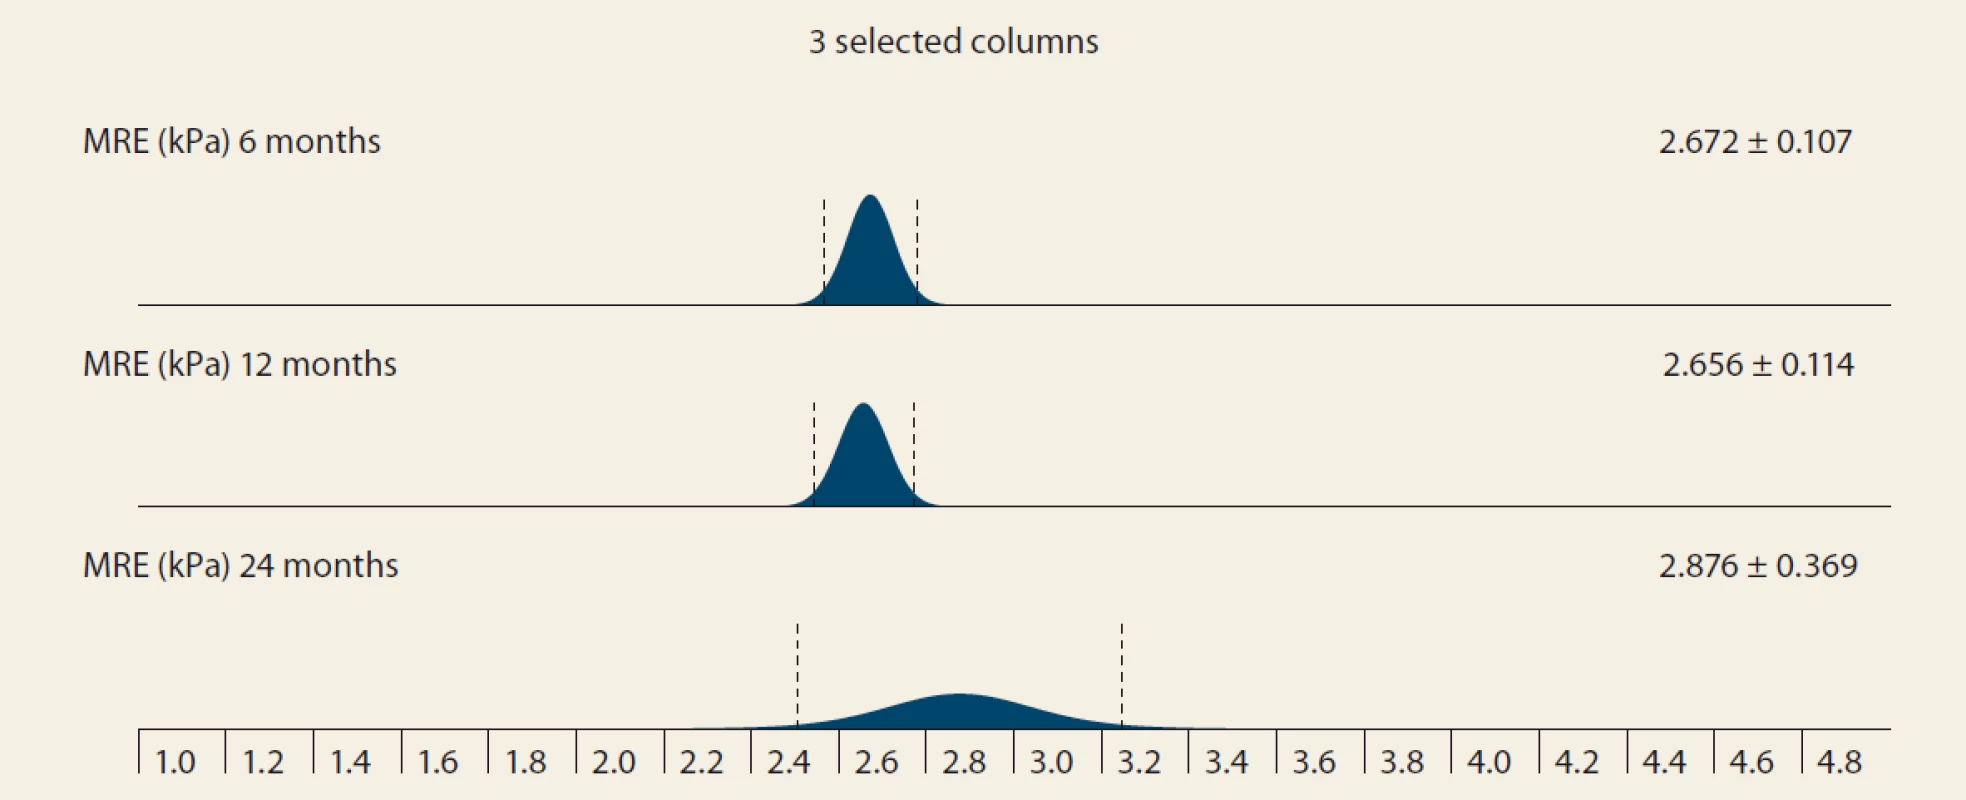
Significant fibrosis by MRE at months 6, 12 and 24 was present in 26.8%, 29.6% and 46.2% of the pts, resp. (P = 0.07 and P = 0.1, resp.). MRE (mean ± SD kPa, months 6, 12, 24; P = 0.368): 2.672 ± 0.107; 2.656 ± 0.114 (P = 0.123); 2.876 ± 0.369 (P = 0.197) (Tab. 5 and Fig. 4).
Tab. 5. Štatistická analýza –
MR elastografi a v čase.
Obr. 4. MR elastografi a (kPa) v čase – stredná hodnota SD, 6 oproti 12 mesiacom, p = 0,123; 12 verzus 24 mesiacov, p = 0,197.
Discussion
The most important finding of this single-centre prospective study covering an almost 5-year span was that the presence of de novo NAFLD was high and increasing: in 26% of the pts 6 months and in 42.5% of the pts 2 years after LTx, resp. Since our centre does not use protocol-biopsies (performed each year, irrespective of clinical and laboratory findings), we diagnosed de novo NAFLD by MRS. In the current era of the search for non-invasive diagnostic tools for NAFLD, MRS has been described as the most promising instrument – with an accuracy similar, if not identical to liver histology [23–25]. The rate of de novo NAFLD in our study is comparable to 48% after 3 years, found in the study by Galvin et al. [17] and higher than in three other studies. Seo et al. reported 18% steatosis and 9% NASH in a similar cohort at a median of 28 months, Dumortier et al. reported NAFLD in 31.1% during a median of 40 months, and Kim et al. found de novo NAFLD incidence of 27% [15,16,29]. Our results add to the literature on the impact of de novo NAFLD, which could be more important than previously thought, since it may significantly affect the prognosis by promoting fibrosis and cirrhosis. We determined that almost 29% of the pts with de novo NAFLD one year after LTx had significant fibrosis (≥ 2.88 kPa on MRE). The above-mentioned study by Galvin et al. showed significant fibrosis in 40.0% of the biopsies of patients with de novo NAFLD 3 years after LTx [17]. Morisaka et al. considered MRE to be a viable alternative to a liver biopsy for the staging of fibrosis [28]. Not using liver biopsies for comparison with MRI can be considered a limitation of our study. However, we believe that, in the near future, MRI at the head of non-invasive modalities will play an increasing role in diagnosing NAFLD as well as the staging of the fibrosis [25].
There are other results in our study which add to the validity of the results in terms of increasing liver fat content over time after LTx – BMI, and FLI. The BMI increased significantly during the 1st year (P < 0.01). According to FLI measured at months 3, 6, 12 and 24, NAFLD was present in 39%, 39%, 42% and 53% of the patients, resp. These results are higher than those achieved by the MRS but still comparable to the prevalence in literature. Apart from the absence of systematic liver biopsies, there is another drawback to our study. We have not studied the main environmental, lifestyle, host and graft risk factors of de novo NAFLD. The most important factors cited in literature are a sedentary lifestyle, obesity by BMI or waist circumference, high blood pressure, DM type 2, high triglycerides, low HDL-cholesterol, donor graft steatosis, hepatic denervation and immunosuppression after LTx [17,30,31]. Immunosuppressive protocol in our TC includes a triple combination of intravenous methylprednisolone 500 mg in the anhepatic phase followed by a daily intravenous dose of 20 mg with a switch to oral dose at the resumption of oral intake, tapering over 3–6 months, tacrolimus 0.1 mg/ kg/ day, or ciclosporin 5–10 mg/ kg/ day and mycophenolate mofetil 2,000 mg/ day. Tacrolimus increases hyperlipidaemia and incidence of obesity, DM (NODAT – new onset diabetes after transplantation) and arterial hypertension. Ciclosporin A has the same side effects, but has a more significant effect on hyperlipidaemia, while the incidence of NODAT is lower [17,31]. Glucocorticoids and weight gain also predispose the development of de novo NAFLD and NODAT following LTx [17,31]. Although we have studied some of these associations in another work, we were unable to link these risk factors to the occurrence of NAFLD in the current study [32]. Furthermore, we have not studied the clinical impact of de novo NAFLD on the prognosis of our patients. Prior studies have shown that patients with recurrent NAFLD are at increased risk of cardiovascular events and renal impairment [14,17,19]. On the basis of the shared metabolic risk factors, post‐LT patients with de novo NAFLD are likely to be at increased risk of cardiovascular death, in addition to progression to liver cirrhosis and subsequent complications of portal hypertension [17]. Early recognition and targeted therapy could potentially reduce the risk of the associated complications.
Conclusions
In conclusion, our study identified rising BMI, liver fat content by LFI, and MRI up to 2 years after LTx. As early as 6 months after LTx, one in four pts had MRS-detected NAFLD. As early as 1 year after LTx, one in three patients had MRE-detected fibrosis of the liver graft.
Submitted/ Doručené: 15. 3. 2020
Accepted/ Prajaté: 31. 3. 2020
Adamcova Selcanova Svetlana, MD, PhD
Department of Internal Medicine II
Faculty of Medicine
F. D. Roosevelt Hospital
Square L. Svobodu 1, Banska Bystrica
Slovak republic
Conflict of Interest: The authors declare that the article/ manuscript complies with ethical standards, patient anonymity has been respected, and they state that they have no financial, advisory or other commercial interests in relation to the subject matter.
Publication Ethics: This article/ manuscript has not been published or is currently being submitted for another review. The authors agree to publish their name and e-mail in the published article/ manuscript.
Dedication: The article/ manuscript is not supported by a grant nor has it been created with the support of any company.
The Editorial Board declares that the manuscript met the ICMJE „uniform requirements“ for biomedical papers.
Konflikt záujmov: Autori deklarujú, že text článku zodpovedá etickým štandardom, bola dodržaná anonymita pacientov, a vyhlasujú, že v súvislosti s predmetom článku nemajú finančné, poradenské ani iné komerčné záujmy.
Publikačná etika: Príspevok nebol doteraz publikovaný ani nie je v súčasnosti zaslaný do iného časopisu na posúdenie. Autori súhlasí s uverejnením svojho mena a e-mailového kontaktu v publikovanom texte.
Dedikácia: Článok nie je podporený grantom ani nevznikol za podpory žiadnej spoločnosti.
Redakčná rada potvrdzuje, že rukopis práce splnil ICMJE kritériá pre publikácie zasielané do biomedicínskych časopisov.
Sources
1. Younossi ZM, Koenig AB, Abdelatif D et al. Global epidemiology of nonalcoholic fatty liver disease – meta-analytic assessment of prevalence, incidence, and outcomes. Hepatology 2016; 64(1): 73–84. doi: 10.1002/ hep.28431.
2. Brunt EM, Wong VW, Nobili V et al. Nonalcoholic fatty liver disease. Nat Rev Dis Primers 2015; 17(1): 15080. doi: 10.1038/ nrdp.2015.80.
3. De Franchis R, Baveno VI Faculty. Expanding consensus in portal hypertension: report of the Baveno VI Consensus Workshop: stratifying risk and individualizing care for portal hypertension. J Hepatol 2015; 63(3): 743–752. doi: 10.1016/ j.jhep.2015.05.022.
4. EASL-EASD-EASO Clinical Practice Guidelines for the management of non-alcoholic fatty liver disease. European Association for the Study of the Liver (EASL), European Association for the Study of Diabetes (EASD), European Association for the Study of Obesity (EASO). J Hepatol 2016; 64(6): 1388–1402. doi: 10.1016/ j.jhep.2015.11.004.
5. Wong RJ, Aguilar M, Cheung R et al. Nonalcoholic steatohepatitis is the second leading etiology of liver disease among adults awaiting liver transplantation in the United States. Gastroenterology 2015; 148(3): 547–555. doi: 10.1053/ j.gastro.2014.11.039.
6. Davidson JA, Wilkinson A. International Expert Panel on New‐Onset Diabetes after Transplantation. New‐Onset Diabetes After Transplantation 2003 International Consensus Guidelines: an endocrinologist’s view. Diabetes Care 2004; 27(3): 805–812. doi: 10.2337/ diacare.27.3.805.
7. Pham PT, Pham PM, Pham SV et al. New onset diabetes after transplantation (NODAT): an overview. Diabetes Metab Syndr Obes 2011; 4 : 175–186. doi: 10.2147/ DMSO.S19027.
8. Watt KD, Pedersen RA, Kremers WK et al. Evolution of causes and risk factors for mortality post‐liver transplant: results of the NIDDK long‐term follow‐up study. Am J Transplant 2010; 10(6): 1420–1427. doi: 10.1111/ j.1600-6143.2010.03126.x.
9. Bhagat V, Mindikoglu AL, Nudo CG et al. Outcomes of liver transplantation in patients with cirrhosis due to nonalcoholic steatohepatitis versus patients with cirrhosis due to alcoholic liver disease. Liver Transpl 2009; 15(12): 1814–1820. doi: 10.1002/ lt.21927.
10. Yalamanchili K, Saadeh S, Klintmalm GB et al. Nonalcoholic fatty liver disease after liver transplantation for cryptogenic cirrhosis or nonalcoholic fatty liver disease. Liver Transpl 2010; 16(4): 431–439. doi: 10.1002/ lt.22004.
11. Contos MJ, Cales W, Sterling RK et al. Development of nonalcoholic fatty liver disease after orthotopic liver transplantation for cryptogenic cirrhosis. Liver Transpl 2001; 7(4): 363–373. doi: 10.1053/ jlts.2001.23011.
12. Charlton M, Kasparova P, Weston S et al. Frequency of nonalcoholic steatohepatitis as a cause of advanced liver disease. Liver Transpl 2001; 7(7): 608–614. doi: 10.1053/ jlts.2001.25453.
13. Hejlova I, Honsova E, Sticova E et al. Prevalence and risk factors of steatosis after liver transplantation and patients outcomes. Liver Transpl 2016; 22(5): 644–655. doi: 10.1002/ lt.24393.
14. Dureja P, Mellinger J, Agni R et al. NAFLD recurrence in liver transplant recipients. Transplantation 2011; 91(6): 684–689. doi: 10.1097/ TP.0b013e31820b6b84.
15. Seo S, Maganti K, Khehra M et al. De novo nonalcoholic fatty liver disease after liver transplantation. Liver Transpl 2007; (13)6 : 844–847. doi: 10.1002/ lt.20932.
16. Dumortier J, Giostra E, Belbouab S et al. Non-alcoholic fatty liver disease in liver transplant recipients: another story of „seed and soil”. Am J Gastroenterol 2010; 105(3): 613–620. doi: 10.1038/ ajg.2009.717.
17. Galvin Z, Rajakumar R, Chen E et al. Predictors of de novo nonalcoholic fatty liver disease after liver transplantation and associated fibrosis. Liver Transpl 2019; 25(1): 56–67. doi: 10.1002/ lt.25338.
18. Burke A, Lucey MR. Non-alcoholic fatty liver disease, non-alcoholic steatohepatitis and orthotopic liver transplantation. Am J Transplant 2004; 4(5): 686–693. doi: 10.1111/ j.1600-6143.2004.0 0432.x.
19. Mikolasevic I, Orlic L, Hrstic I et al. Metabolic syndrome and non‐alcoholic fatty liver disease after liver or kidney transplantation. Hepatol Res 2016; 46(9): 841–852. doi: 10.1111/ hepr.12642.
20. Fatty Liver Index. [online]. Available from: https:/ / www.mdapp.co/ fatty-liver-index-fli-calculator-356/ .
21. Bedogni G, Bellentani S, Miglioli L et al. The fatty liver index: a simple and accurate predictor of hepatic steatosis in the general population. BMC Gastroenterol 2006; 6 : 33. doi: 10.1186/ 1471-230X-6-33.
22. Machado MV, Cortez-Pinto H. Non-invasive diagnosis of non-alcoholic fatty liver disease. A critical appraisal. J Hepatol 2013; 58(5): 1007–1019. doi: 10.1016/ j.jhep.2012.11.021.
23. Idilman IS, Aniktar H, Idilman R et al. Hepatic steatosis: quantification by proton density fat fraction with MR imaging versus liver biopsy. Radiology 2013; 267(3): 767–775. doi: 10.1148/ radiol.13121360.
24. Gu J, Liu S, Du S et al. Diagnostic value of MRI-PDFF for hepatic steatosis in patients with non-alcoholic fatty liver disease: a meta-analysis. Eur Radiol 2019; 29(7): 3564–3573. doi: 10.1007/ s00330-019-06072-4.
25. Newsome PN, Sasso M, Deeks JJ et al. FibroScan-AST (FAST) score for the non-invasive identification of patients with non-alcoholic steatohepatitis with significant activity and fibrosis: a prospective derivation and global validation study. Lancet Gastroenterol Hepatol 2020; 5(4): 362–373. doi: 10.1016/ S2468-1253(19)30383-8.
26. Yin M, Talwalkar JA, Glaser KJ et al. Assessment of hepatic fibrosis with magnetic resonance elastography. Clin Gastroenterol Hepatol 2007; 5(10): 1207–1213. doi: 10.1016/ j.cgh.2007.06.012.
27. Loomba R, Wolfson T, Ang B et al. Magnetic resonance elastography predicts advanced fibrosis in patients with nonalcoholic fatty liver disease: a prospective study. Hepatology 2014; 60(6): 1920–1928. doi: 10.1002/ hep.27362.
28. Morisaka H, Motosugi U, Ichikawa S et al. Magnetic resonance elastography is as accurate as liver biopsy for liver fibrosis staging. J Magn Reson Imaging 2018; 47(5): 1268–1275. doi: 10.1002/ jmri.25868.
29. Kim H, Lee K, Lee KW et al. Histologicallyproven non-alcoholic fatty liver disease and clinically related factors in recipients after liver transplantation. Clin Transplant 2014; 28(5): 521–529. doi: 10.1111/ ctr.12343.
30. Vallin M, Guillaud O, Boillot O et al. Reccurent or de novo non-alcoholic fatty liver disease after liver transplantation: natural history based on liver biopsy analysis. Liver Transpl 2014; 20(9): 1064–1071. doi: 10.1002/ lt.23936.
31. Shaker M, Tabbaa A, Albedawi M et al. Liver transplantation for nonalcoholic fatty liver disease: new challenges and new opportunities. World J gastroenterol 2014; 20(18): 5320–5330. doi: 10.3748/ wjg.v20.i18.5320.
32. Skladany L’, Mesarosova Z, Bachova B et al. Alcohol-related liver disease as a new risk factor for post-transplant diabetes after liver transplantation. Transplant Proc 2019; 51(10): 3369–3374. doi: 10.1016/ j.transproceed.2019.07.021.
Labels
Paediatric gastroenterology Gastroenterology and hepatology SurgeryArticle was published in
Gastroenterology and Hepatology
2020 Issue 2
- Possibilities of Using Metamizole in the Treatment of Acute Primary Headaches
- Metamizole at a Glance and in Practice – Effective Non-Opioid Analgesic for All Ages
- Metamizole vs. Tramadol in Postoperative Analgesia
- Spasmolytic Effect of Metamizole
- The Importance of Limosilactobacillus reuteri in Administration to Diabetics with Gingivitis
-
All articles in this issue
- Covid-19 and the liver
- Editorial
- Guideline of the Czech Hepatology Society of the ČLS JEP for diagnosis and treatment of non-alcoholic fatty liver disease
- Doporučení pro léčbu idiopatických střevních zánětů v době pandemie covid-19
- Recommendations of the Slovak IBD Working Group on SGS for the Treatment of Biosimilar Anti-TNF Biologics in Adult and Pediatric Patients
- Endoscopic drainage of infected pancreatic necrosis with complicated course – case report
- Four-year experience of infliximab and adalimumab pharmacokinetics monitoring in patients with inflammatory bowel disease
- Position of vedolizumab in the current treatment of Crohn’s disease
- Laser lithotripsy as a solution of an obturating biliary stone in the colon
- Anderson-Fabry disease and gastrointestinal tract involvement
- Gastroenterology and gastrointestinal endoscopy under SARS-CoV-2 pandemic conditions
- 90th Associate Professor Milose Sedlackova, MD
- Anniversary of Ass. Hana Dvorakova, MD
- Comment on the article: Caha M, Politová P, Vlk R et al. The surprising cause of death of a patient with upper gastrointestinal bleeding. Gastroent Hepatol 2020; 74(1): 50–53. doi: 10.14735/ amgh202050.
- The selection from international journals
- Kreditovaný autodidaktický test
- Infection in patients hospitalised with advanced chronic liver disease (cirrhosis) – single-centre experience
- De novo non-alcoholic fatty liver disease after liver transplantation – as diagnosed by magnetic resonance
-
Novel Pancreatic Developmentsprof. Peter Layer – Gastro Update Europe 2019, Budapest
Nové poznatky o pankreatu -
Biliopancreatic endoscopy
prof. Marco Bruno – Gastro Update Europe 2019, Budapest - Novel Developments In Intestinal Endoscopy<br> prof. Oliver Pech – Gastro Update Europe 2019, Budapest
- Gastroenterology and Hepatology
- Journal archive
- Current issue
- About the journal
Most read in this issue
- Covid-19 and the liver
- Endoscopic drainage of infected pancreatic necrosis with complicated course – case report
- Guideline of the Czech Hepatology Society of the ČLS JEP for diagnosis and treatment of non-alcoholic fatty liver disease
- Doporučení pro léčbu idiopatických střevních zánětů v době pandemie covid-19
