TESTING A SYSTEM FOR PREDICTING MICROSLEEP
An instrument to objectively measure driver’s fatigue and to monitor approaching micro-sleep was designed, manufactured and tested. The instrument is based on a simple infrared sensor, which consists of an emitter and detector and is based on the different reflectivity of the eye and the skin of the eyelid. The instrument records eyelid activity as the number of blinks. The device has been put into practice in the form of lensless glasses and tested in an automobile simulator at the Faculty of Transport, Czech Technical University in Prague. The results show that the system was reasonably efficient at detecting fatigue, and therefore potentially micro-sleep. However, currently it is not possible to measure the effectiveness of the system and evaluate the results in real-time.
Keywords:
microsleep, prevention, infrared sensor, transportation
Authors:
Pavel Spurný 1; Jakub Andrš 1; Peter Bouchner 2; Jiří Pučelík 1; Richard Rokyta 1
Authors‘ workplace:
Charles University, 3rd Faculty of Medicine, Department of Normal, Pathological and Clinical Physiology, Prague, Czech Republic
1; Czech Technical University, Faculty of Transportation Sciences, Prague, Czech Republic
2
Published in:
Lékař a technika - Clinician and Technology No. 2, 2016, 46, 51-54
Category:
Original research
Overview
An instrument to objectively measure driver’s fatigue and to monitor approaching micro-sleep was designed, manufactured and tested. The instrument is based on a simple infrared sensor, which consists of an emitter and detector and is based on the different reflectivity of the eye and the skin of the eyelid. The instrument records eyelid activity as the number of blinks. The device has been put into practice in the form of lensless glasses and tested in an automobile simulator at the Faculty of Transport, Czech Technical University in Prague. The results show that the system was reasonably efficient at detecting fatigue, and therefore potentially micro-sleep. However, currently it is not possible to measure the effectiveness of the system and evaluate the results in real-time.
Keywords:
microsleep, prevention, infrared sensor, transportation
Introduction
Micro-sleep, or ‘falling asleep at the wheel,’ is a well-known problem with serious implications. The consequence of micro-sleep is manifest as daily car accidents, many of which result in fatalities. The US National Highway Traffic Safety Administration reported that in 2013, driving while fatigued resulted in 72,000 accidents, 44,000 injuries and 800 deaths. However, other studies suggest the death rate is much higher and may be near 6,000 deaths per year. In the past, many companies have attempted to address this problem by developing methods to predict driver fatigue and thus significantly reduce the risk of drivers falling asleep at the wheel and causing serious accidents. The first methods of detecting the approach micro-sleep were based on EEG studies [1, 2, 3, 4, 5]. These systems were accurate enough, but in practice, they were extremely impractical. Other studies [6, 7, 8, 9, 10] dealt with the detection of micro-sleep through evaluation of blinking using cameras and computer technology oriented on image segmentation recognition of specific areas of the face. Now, with the current advances in science and technology, we finally have several sufficiently accurate and functional methods that can be exploited.
The main methods in use today involve wheel motion sensors or a camera located in the rearview mirror, or a combination of the two. The data is processed by a control unit and when it recognizes a state of fatigue, an audible signal is sent to alert the driver, thereby decreasing risk of micro-sleep. However, these methods are costly and only available on specific high-end brands of new cars, which effectively mean the technology is available to only those who can afford it.
This project builds on an earlier study [10] that developed the OPTUS device, which is based on the fact that the frequency of blinking increases during fatigue. The system operates on a simple physical principle involving the differential reflection of infrared radiation off the surface of the eye compared to the skin on the eyelid.
The objective of this study was to test the OPTUS device under simulated driving conditions and use the results as a part of the further development of a device that can predict the onset of micro-sleep. The goal is to develop a portable, simple, and inexpensive device that is accurate enough to reliably reduce the risk of micro-sleep, and which can be used by all drivers, regardless of vehicle.
Description of instrument OPTUS
The main theme of the entire system is simplicity and effectiveness. Therefore, only the most basic parts were used to construct the device. The entire measurement system consists of (1) an infrared (IR) element, which also acts as the emitter and the detector, which was developed by [10], (2) the OPTUS glasses frames, in which the sensor is placed (Fig. 1), and (3) the necessary electronic circuits for amplifying and filtering the raw signals (transmitted by a data cable to the DC / DC converter). The converter is connected by a USB cable to a computer, which uses specific software to record and save the signals. Data can then be exported to a “csv” file for subsequent processing and analysis in the MATLAB® programming environment. The complete measurement system was developed by Ing. Pučelík, Pilsen, CZ.

The device is based on the differential reflectance of IR radiation of the eye relative to the skin of the eyelids. Once a blink takes place, a photoelectric detector senses a different signal and the system evaluates this phenomenon as a positive or negative peak [10]. The schematic for the IR element is shown and described in Fig. 2. Fig. 3 demonstrates the real measurement situation.
![Fig. 2: Diagram of the basic principle of the optoelectronic sensor. [10]](https://pl-master.mdcdn.cz/media/image/b58c7ed21f64427dc5ee210ac3051640.jpg?version=1537796106)

Methods
Measurements were carried out using a car simulator, supplied by prof. Bouchner, Faculty of Transportation, Czech Technical University in Prague.
Ten subjects were tested on the simulator using the OPTUS device. Participants had to have a valid driver’s license and be physically fit. In this particular test, all drivers were between the age of 20 and 25 years. The experiment was divided into two phases. The first phase included familiarization with the simulators and the OPTUS device, followed by the sample measurements. The second stage, which took place one week later, was based on the measurement of blink activity while the participants were in a state of sleep deprivation (participants did not sleep at all the night before testing). Additionally, participants were not allowed to consume caffeine, alcohol, energy, or other stimulant drinks during a 6 hour period immediately prior to testing.
Each measurement was carried out under conditions suitable to induce micro-sleep (i.e., night-time driving simulation, medium traffic conditions, and monotonous driving conditions). Each test run lasted 10 minutes and was repeated three times, with ten-minute rest breaks in between simulations.
Data analysis was carried out in the Matlab® program environment. The first interfering signal component was removed, after which the program started counting the number of blinks (Fig. 4).

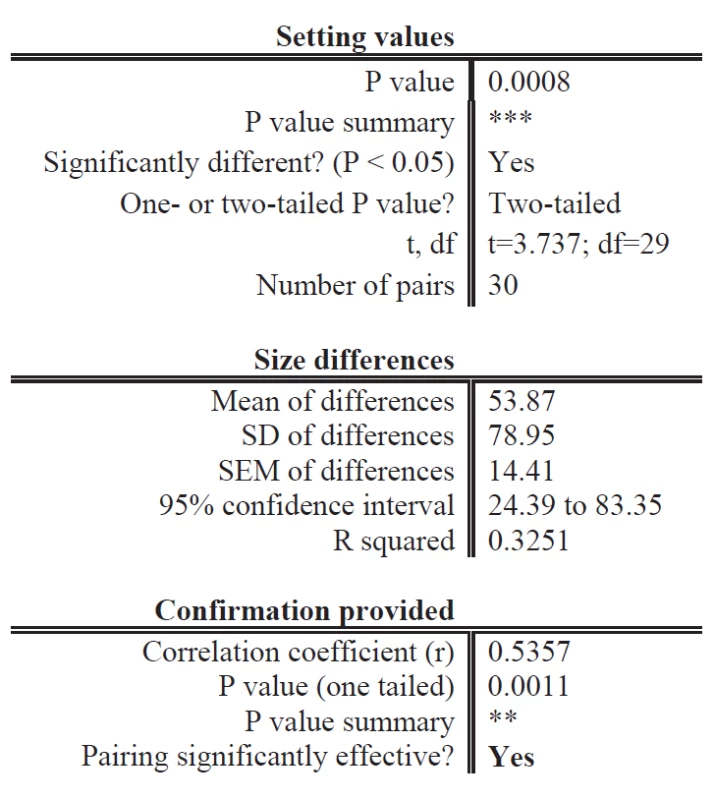
The Student's paired t-test was used to compare the mean values between the first (i.e., the beginning of each 10 min test period) and second elements (i.e., the end of each 10 min test period) of the ordered pairs. The paired t-test was considered most suitable for this analysis since it was necessary to compare the results of the behavior of a group of participants in two different states (i.e., rested vs. fatigued). GraphPad was used as the processing program.
Results
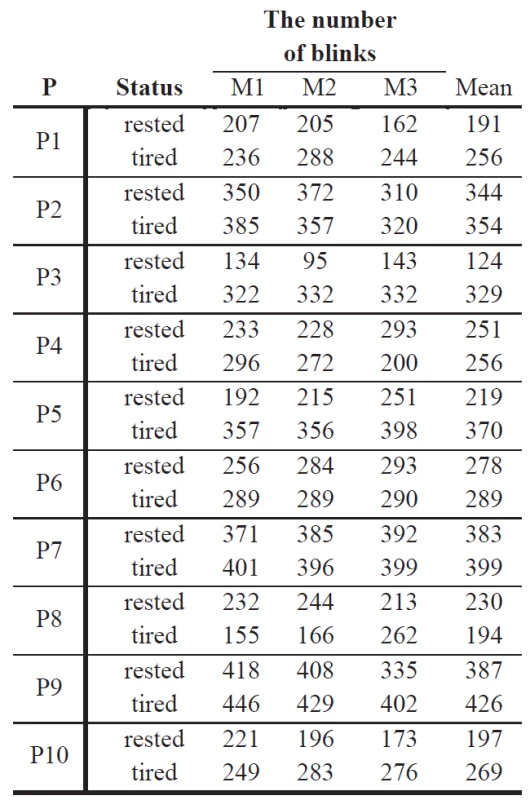
Calculated values of the number of blinks for each participant are listed in Tab. 1.

The graph in Fig. 5 is a statistical summary showing that fatigued participants blinked significantly more often than when they were in a rested state. Statistical details for the paired t-test, differences in size, and the P value are presented in Tab. 2.


Discussion
From the above results we concluded that the OPTUS instrument can detect, monitor, and evaluate fatigue and approaching micro-sleep. We found that head movements introduced artifacts that affected the quality of the measurements. The issue of movement will need to be addressed and technical or programming solutions will need to be developed to remove movement related artifacts.
The measuring system design was simple, functional, and capable of objective sensing driver’s fatigue. Using currently available wireless technology and the diminutive size of the electrical components, it seems certain that a device like the OPTUS device can be developed based on the glasses shown in Fig. 3 that could help drivers around the world to predict micro-sleep.
Conclusion
We tested a prototype system for objective measurement of the onset of micro-sleep while driving. The system is based on opto-electrical sensing of the right eye. Blinking of the eye produces a significant change in the signal that can be easily detected and interpreted. Our initial testing of 10 participants in a driving simulator, in which we compared blink rates during rested and tired states, found that the device was able to objectively and accurately measure driver’s fatigue and therefore could be used to predict approaching micro-sleep.
Acknowledgement
The research was supported by Prvouk P34.
Prof. Richard Rokyta, MD, Ph.D, DSc.
Department of Normal, Pathological and
Clinical Physiology
3rd Faculty of Medicine
Charles University
Ke Karlovu 4, 120 00 Praha 2
Czech Republic
E-mail: richard.rokyta@lf3.cuni.cz
Phones: +420 608 144 228, +420 607 900 228
Sources
[1] M. T. R. Peiris, R. D. Jones, P. R. Davidson, a P. J. Bones, “Detecting Behavioral Microsleeps from EEG Power Spectra”, in 28th Annual International Conference of the IEEE Engineering in Medicine and Biology Society, 2006. EMBS 2006, 5723–5726.
[2] M. Golz, D. Sommer, M. Holzbrecher, a T. Schnupp, “Detection and prediction of driver’s microsleep events”, Rese-archGate, 2009.
[3] “SmartCap Fatigue Monitoring System”. [Online]. http://smartcaptech.com/.
[4] J. Toppi, L. Astolfi, G. R. Poudel, C. R. H. Innes, F. Babiloni, a R. D. Jones, “Time-varying effective connectivity of the cortical neuroelectric activity associated with behavioural microsleeps”, NeuroImage, 124, Part A, 421–432, 2016.
[5] P. Svoboda, EEG Analysis and Classification of Microsleep on the Car Simulator (2004) - data IS VaVaI". [Online]. https://www.isvav.cz/resultDetail.do?rowId=RIV%2F68407700%3A21260%2F04%3A06104715!RIV%2F2005%2FMSM%2F212605%2FN. [09-March-2016].
[6] A. M. Malla, P. R. Davidson, P. J. Bones, R. Green, a R. D. Jones, “Automated video-based measurement of eye closure for detecting behavioral microsleep”, in 2010 Annual International Conference of the IEEE Engineering in Medicine and Biology Society (EMBC), 2010, 6741–6744.
[7] W. W. Wierwille a L. A. Ellsworth, “Evaluation of driver drowsiness by trained raters”, Accident Analysis & Prevention, 26, 5, 571–581, 1994.
[8] Peiris, Malik T. R., Richard D. Jones, Paul R. Davidson, Grant J. Carroll a Philip J. Bones. Frequent lapses of responsiveness during an extended visuomotor tracking task in non-sleep-deprived subjects. Journal of Sleep Research [online]. 2006, 15(3),291-300[cit.2016-07-22]. http://doi.wiley.com/10.1111/j.1365-2869.2006.00545.x
[9] Q. Ji a X. Yang, “Real-Time Eye, Gaze, and Face Pose Tracking for Monitoring Driver Vigilance”, Real-Time Imaging, 8, 5, 357–377, 2002.
[10] R. Rokyta, J. Pučelík, J. Dudák a A. Yamamotová. Objektivní měření únavy frekvencí mrkání. Lékař a technika: Clinician and Technology. Praha, 2013,43(3), 4. ISSN 2336-5552.
Labels
BiomedicineArticle was published in
The Clinician and Technology Journal

2016 Issue 2
-
All articles in this issue
- CROSSOVER FROM AUTOMATED TO MANUAL TITRATION OF FiO2 IN THE NICU: IS THERE A TRANSITION LAG?
- DESIGN CONCEPTS FOR PREVENTING GAS BUBBLE INTERFERENCE IN MICROFLUIDIC DEVICES
- CELL-BASED SENSOR CHIP FOR NEUROTOXICITY MEASUREMENTS IN DRINKING WATER
- TESTING A SYSTEM FOR PREDICTING MICROSLEEP
- EARLY DISCHARGE (48–72 HOURS) AFTER ACUTE ST-SEGMENT ELEVATION MYOCARDIAL INFARCTION: INTERIM RESULTS OF THE OPEN, RANDOMIZED, MONOCENTRIC STUDY
- The Clinician and Technology Journal
- Journal archive
- Current issue
- About the journal
Most read in this issue
- EARLY DISCHARGE (48–72 HOURS) AFTER ACUTE ST-SEGMENT ELEVATION MYOCARDIAL INFARCTION: INTERIM RESULTS OF THE OPEN, RANDOMIZED, MONOCENTRIC STUDY
- CELL-BASED SENSOR CHIP FOR NEUROTOXICITY MEASUREMENTS IN DRINKING WATER
- TESTING A SYSTEM FOR PREDICTING MICROSLEEP
- DESIGN CONCEPTS FOR PREVENTING GAS BUBBLE INTERFERENCE IN MICROFLUIDIC DEVICES
