Optical coherence tomography measurements of the optic nerve head and retina in newly diagnosed idiopathic intracranial hypertension without loss of vision
Měření terče zrakového nervu a sítnice pomocí optické koherentní tomografie u nově diagnostikované idiopatické intrakraniální hypertenze bez ztráty zraku
Cíl: Idiopatická intrakraniální hypertenze (IIH) je charakterizována zvýšeným intrakraniálním tlakem (intracranial pressure; ICP), a to obvykle u mladých obézních žen bez patologie oběhového systému. Zkoumali jsme vztah mezi měřeními optické koherentní tomografie (optical coherence tomography; OCT) a otevíracím tlakem mozkomíšního moku (cerebrospinal fluid; CSF) u nově diagnostikovaných pacientů s IIH, kteří dosud nebyli léčeni.
Materiál a metody: Do studie bylo zařazeno 19 osob s diagnózou IIH a 22 zdravých osob v kontrolní skupině. V obou skupinách jsme měřili tloušťku vrstvy nervových vláken sítnice (retinal nerve fibre layer; RNFL), fovey (F) a komplexu gangliových buněk (ganglion cell complex; GCC) a parametry terče zrakového nervu.
Výsledky: Průměrné tloušťky RNFL a F byly výrazně vyšší ve skupině pacientů než v kontrolní skupině (p < 0,01). V průměrné hodnotě tloušťky GCC nebyl mezi pacienty a kontrolní skupinou žádný statistický rozdíl. Při porovnání tloušťky RNFL podle kvadrantů měli pacienti s IIH výrazně vyšší hodnoty ve všech kvadrantech. Ve skupině pacientů byly parametry pozitivně korelujícími s otevíracím tlakem CSF stupeň edému papily (rho = 0,869, p < 0,01), doba trvání symptomů papily (rho = 0,458, p = 0,049) a index tělesné hmotnosti (rho = 0,653, p = 0,002).
Závěr: Zvýšená tloušťka peripapilární RNFL a F naměřená pomocí OCT je u nově diagnostikovaných pacientů s IIH spojená se zvýšeným ICP. OCT tak může u pacientů s podezřením na IIH sloužit jako cenný doplněk při subjektivním hodnocení edému papily.
Autoři deklarují, že v souvislosti s předmětem studie nemají žádné komerční zájmy.
Redakční rada potvrzuje, že rukopis práce splnil ICMJE kritéria pro publikace zasílané do biomedicínských časopisů.
Klíčová slova:
idiopatická intrakraniální hypertenze – optická koherentní tomografie – makula
Authors:
F. Aslan 1; B. Özkal 2
Authors‘ workplace:
Department of Ophthalmology, Alaaddin Keykubat University Research and Education Hospital, Alanya, Turkey
1; Department of Neurosurgery, Alaad din Keykubat University Research and Education Hospital, Alanya, Turkey
2
Published in:
Cesk Slov Neurol N 2019; 82(3): 309-315
Category:
Original Paper
doi:
https://doi.org/10.14735/amcsnn2019309
Overview
Aim: Idiopathic intracranial hypertension (IIH) is characterized by elevated intracranial pressure (ICP), usually in young, obese women with no circulatory pathology. We investigated the relationship between optical coherence tomography (OCT) measurements and cerebrospinal fluid (CSF) opening pressure in newly diagnosed IIH patients who have not been treated yet.
Material and methods: The study included 19 individuals diagnosed with IIH and 22 healthy individuals in the control group. We measured the retinal nerve fibre layer (RNFL), fovea (F) and ganglion cell complex (GCC) thickness as well as the optic nerve head parameters in both groups.
Results: The mean RNFL and F thicknesses were significantly higher in the patient group compared to the control group (P < 0.01). There was no statistical difference in mean GCC thickness between the patient and control groups. When RNFL thickness was compared by quadrant, the IIH patients had significantly higher values in all quadrants. In the patient group, the parameters that correlated positively with CSF opening pressure were papilloedema grade (rho = 0.869, P < 0.01), duration of symptoms (rho = 0.458, P = 0.049) and body mass index (rho = 0.653, P = 0.002).
Conclusion: Increased peripapillary RNFL and F thickness measured by OCT is associated with elevated ICP in newly diagnosed IIH patients. OCT may thus serve as a valuable supplement to the subjective assessment of papilloedema in patients suspected of having IIH.
光学相干断层扫描测量新诊断的特发性颅内高压视神经乳头和视网膜而无视力丧失
目标:
特发性颅内高压(IIH)的特征是颅内压升高(ICP),通常发生在没有循环病变的年轻肥胖女性中。我们研究了光学相干断层扫描(OCT)测量与新诊断的尚未治疗的IIH患者的脑脊液(CSF)开放压力之间的关系。
材料和方法:
该研究包括19名被诊断患有IIH的个体和22名健康个体的对照组。我们测量了两组视网膜神经纤维层(RNFL),中央凹(F)和神经节细胞复合体(GCC)厚度以及视神经乳头参数。
结果:
与对照组相比,患者组的平均RNFL和F厚度显着更高(P <0.01)。患者和对照组之间的平均GCC厚度没有统计学差异。当通过象限比较RNFL厚度时,IIH患者在所有象限中具有显着更高的值。在患者组中,与CSF开放压力呈正相关的参数为乳头水肿等级(rho = 0.869,P <0.01),症状持续时间(rho = 0.458,P = 0.049)和体重指数(rho = 0.653,P = 0.002)。
结论:
OCT测量的围手术期RNFL和F厚度的增加与新诊断的IIH患者的ICP升高有关。因此,OCT可以作为怀疑患有IIH的患者对乳头水肿的主观评估的有价值的补充。
关键词:
特发性颅内高压 - 光学相干断层扫描 - 黄斑
Keywords:
idiopathic intracranial hypertension – optical coherence tomography – macula
Introduction
Idiopathic intracranial hypertension (IIH) is caused by elevated cerebrospinal fluid (CSF) pressure of unknown aetiology. The annual incidence has been estimated in literature to be at most 3/ 100,000. IIH mainly affects young obese females, and in the majority of cases, it causes papilloedema due to increased intracranial pressure (ICP). Long-term papilloedema results in optic nerve atrophy, which may cause permanent vision loss [1]. Swelling of the optic nerve head (ONH) is believed to arise from compression of the retro-laminar optic nerve, which obstructs the axoplasmic flow [2]. Vision loss occurs in 86% of IIH patients and visual deficits can be severe in 10% of cases [3]. Causes of visual impairment in IIH patients include optic neuropathy, chorioretinal folds, hyperopic shift, haemorrhages, macular oedema and subretinal neovascularization. Visual loss in IIH may be reversible if treatment is timely but can be permanent in up to 40% of patients [4].
Optical coherence tomography (OCT) is an easy, quick and non-invasive technique that uses infrared light to obtain in vivo images of the macula and ONH similar to histological resolution. OCT has enabled the detection of abnormalities of the peripapillary retinal nerve fibre layer (RNFL) in newly diag-
nosed and chronic IIH. OCT has proved to be a powerful tool for accurately monitoring of the ONH volume [5,6] and neuro-axonal retinal damage [7–11]. Spectral-domain OCT (SD-OCT) provides continuous variable measurements that demonstrate structural changes in the optic nerve and retina associated with papilloedema and measures the effects of intracranial hypertension and its
treatment.
This study had two aims: to evaluate whether OCT can be used to assess the retina and optic nerve in the newly diagnosed IIH population and to investigate the relationship between changes in CSF pressure and OCT parameters.
Materials and methods
This prospective observational study was conducted in consecutive patients with suspected IIH referred to Alaaddin Keykubat University Education and Research Hospital, Turkey, for lumbar puncture (LP). All patients were newly diagnosed and had not previously received medical treatment
for IIH.
The inclusion criteria were age > 18 years, high CSF opening pressure (≥ 25 cm H2O), normal MRI and MRI venography, normal CSF composition and cytology, normal neurological examination except for papilloedema and probable or definite IIH with papilloedema according to the modified Dandy criteria [12]. Patients who had other ocular or neurological diseases or other medical conditions were excluded from the study. The controls were healthy volunteers with no abnormalities in a brief neuroophthalmologic examination including tonometry, slit-lamp examination and funduscopy. The study was approved by the Ethics Committee of the Alaaddin Keykubat University Faculty of Medicine in Alanya, Turkey. Written informed consent was obtained from all participants in accordance with the Declaration of Helsinki.
All subjects underwent a complete ophthalmologic examination including best-corrected visual acuity (Snellen), colour vision testing (Ishihara’s), visual field analysis with standard automated perimetry (Octopus 300 series V5.14 [Haag-Streit, Köniz, Switzerland]), Goldmann applanation tonometry, slit-lamp anterior segment examination, dilated fundus examination with a 90-D lens and mydriatic optic nerve and macular OCT imaging with RTVue SD-OCT system (RTVue-XR 100 Avanti software v.0.14 [Optovue, Inc., Fremont, CA, USA]). The severity of the papilloedema was graded using the Frisen scale. All ophthalmic examinations and measurements were performed by the same physician (F. A.).
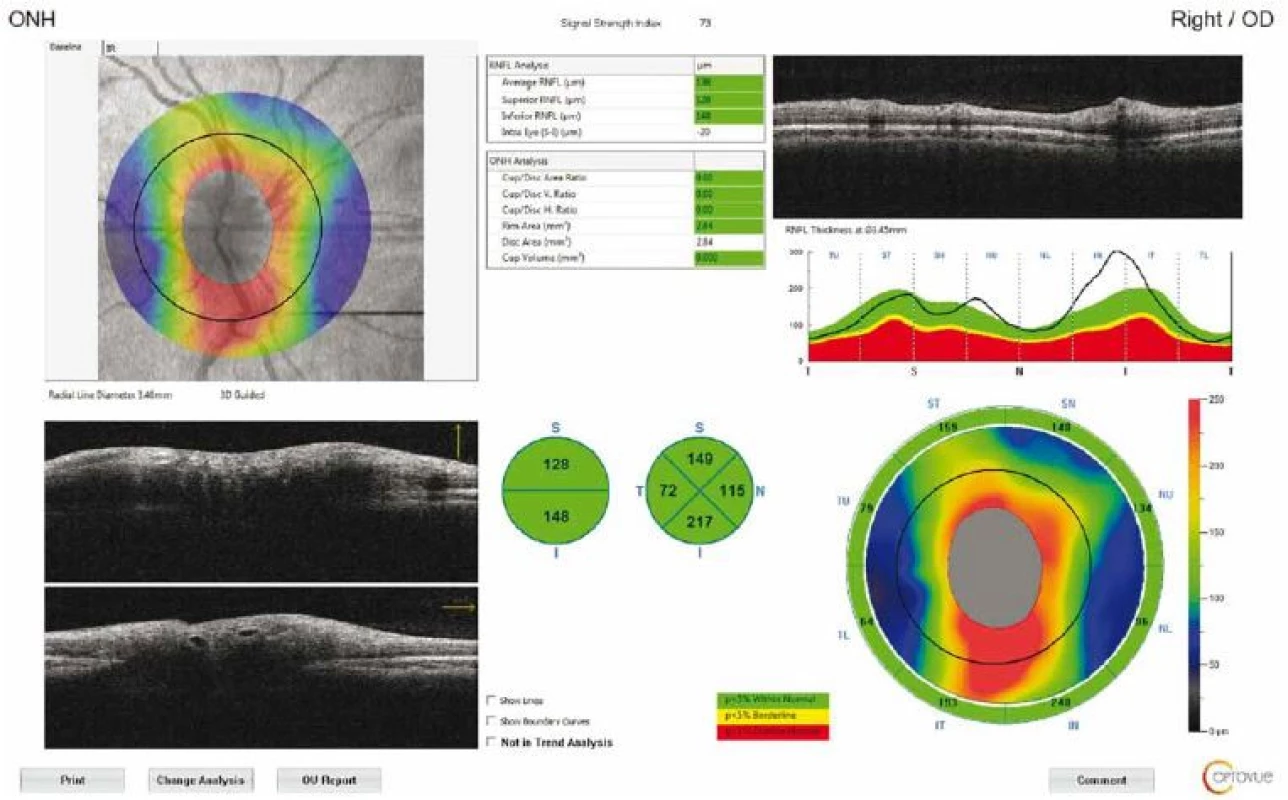
The macula and ONH were evaluated, while the RNFL and GCC thicknesses were measured separately. The measurements were repeated three times for each eye to reduce measurement errors. The RNFL 3.40 protocol was used for peripapillary RNFL analysis, with the thickness measured at a diameter of 3.40 mm around the centre of the optic disc. The results were displayed on a colour map with customized software, with normative data adjusted for age and optic disc size. In the statistical analysis, RNFL thickness measurements were evaluated in four quadrants (superior, inferior, nasal, and temporal) (Fig. 1).
Obr. 1. Výsledek měření tloušťky peripapilární vrstvy nervových vláken sítnice pomocí optické koherentní tomografie u pacienta
s idiopatickou intrakraniální hypertenzí. Na snímku očního pozadí je vidět kruhový sken o průměru 3,4 mm se středem v terči zrakového
nervu.
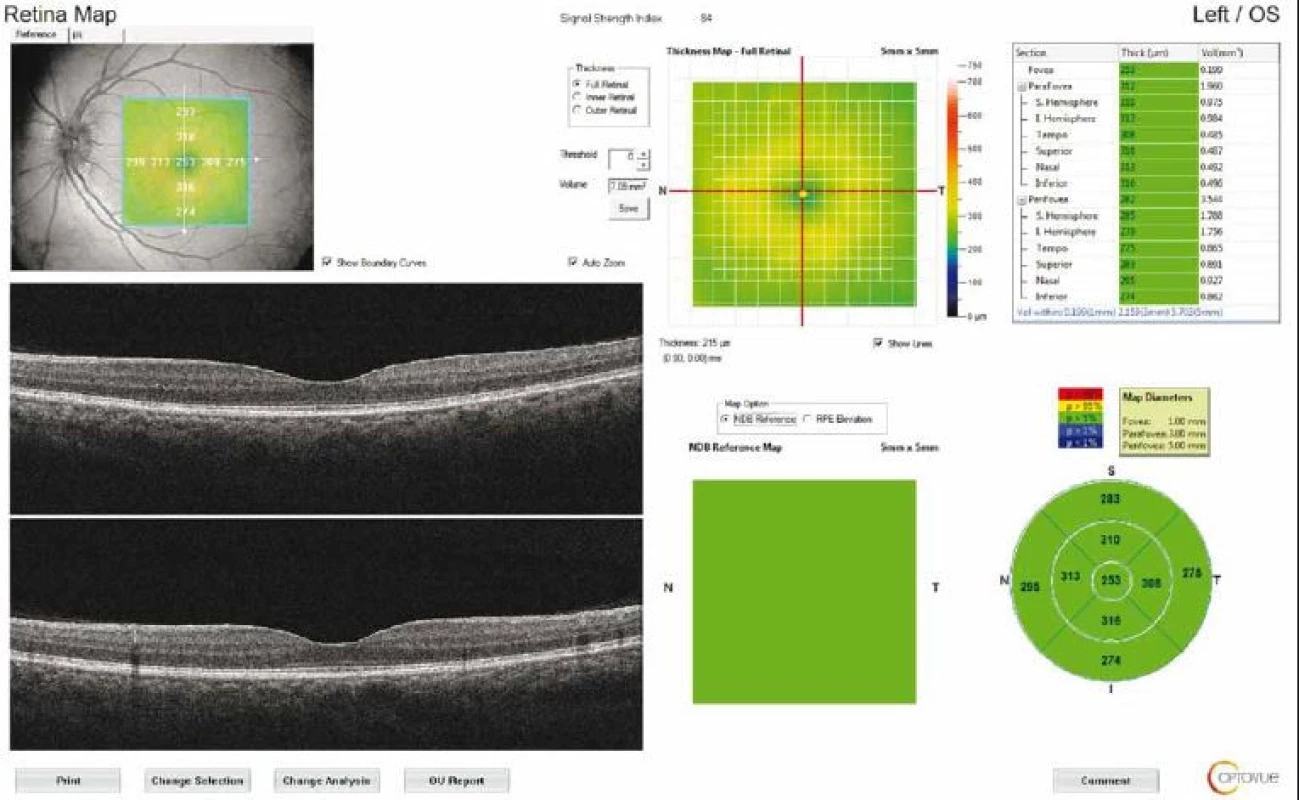
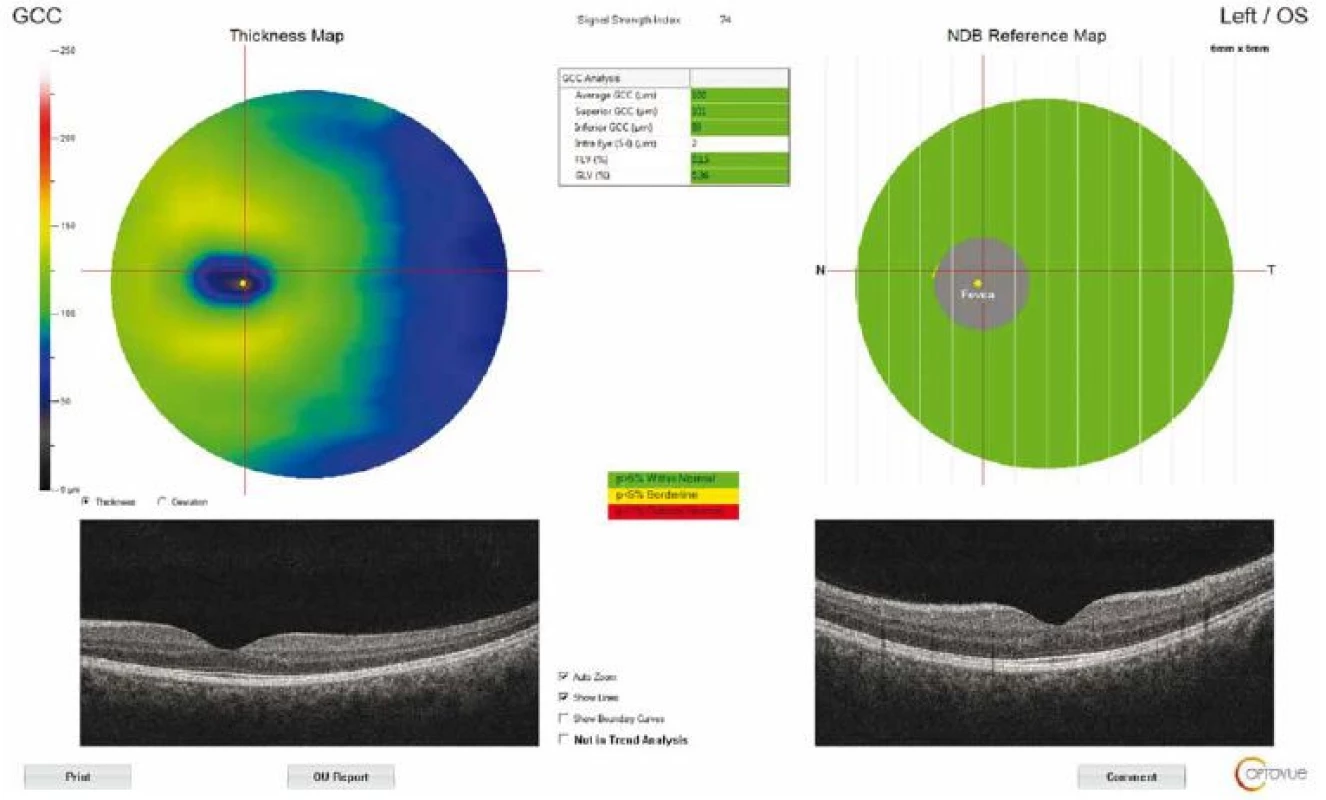
The macular thickness was measured using the retinal map protocol with a 5 × 5-mm area. Foveal (F) measurements were also taken (Fig. 2). GCC measurements consisted of one horizontal line scan 7 mm in length and 15 vertical line scans 7 mm in length taken at 0.5 - mm intervals in a 6 × 6-mm area. The GCC thickness was defined as the distance between the inner limiting membrane and the outer border of the inner plexiform layer (Fig. 3). ONH measurements were performed with 13 concentric circle ring scans and 12 radial line scans.
Obr. 2. Výsledek mapování sítnice u pacienta s idiopatickou intrakraniální hypertenzí. V grafu je znázorněna průměrná tloušťka devíti
oblastí a topografická mapa tloušťky sítnice. Byla zaznamenána tloušťka fovey (centrálně 1 mm).
Obr. 3. Výsledek měření tloušťky komplexu gangliových buněk pomocí optické koherentní tomografie u pacienta s idiopatickou intrakraniální
hypertenzí.
GCC – komplex gangliových buněk; NDB – normativní databáze
An LP was performed at least 24 h after OCT and the patients were not given medication before. The patients were placed in the left lateral decubitus position with their legs fully extended for CSF collection. All LPs were performed by the same physician (B. Ö.). Opening ICP over 25 cm H2O was considered elevated. The CSF samples were evaluated microscopically and biochemically. In all patients, the CSF composition was normal, including cell count and CSF/ serum albumin ratio.
Statistical analysis
Statistical analysis was carried out using NCSS 11 (NCSS Statistical Software, Kaysville, UT, USA). Mean, standard deviation, median, minimum and maximum values were given for continuous variables. The Kolmogorov-Smirnov test was performed to test for normal distribution of continuous variables. An independent sample t-test was used for comparisons of continuous independent variables between the two groups. The Mann–Whitney U test was used to compare two independent groups for variables that did not conform to the normal distribution assumption. Correlations between OCT measurements and other variables were evaluated by nonparametric Spearman’s correlation analysis. Regression analysis was done to assess the effect of body mass index (BMI) and CSF opening pressure on F and RNFL thickness. The linearity test was used to detect linear relationships between dependent and independent variables. The level of significance was accepted as P < 0.05.
Results
Nineteen newly diagnosed IIH patients were enrolled in the study. All the patients were obese (BMI > 25 kg/ m2) women with a mean age of 34.79 ± 7 (20–44) years. Twenty-two age-matched women who had no significant medical or ocular conditions (mean age 33.14 ± 7.05 [20–45]) comprised the control group. The demographic characteristics of the patients are shown in Tab. 1. The anterior segment findings and intraocular pressures were within normal limits in both the cases and the controls. Colour vision was within normal limits in all participants.
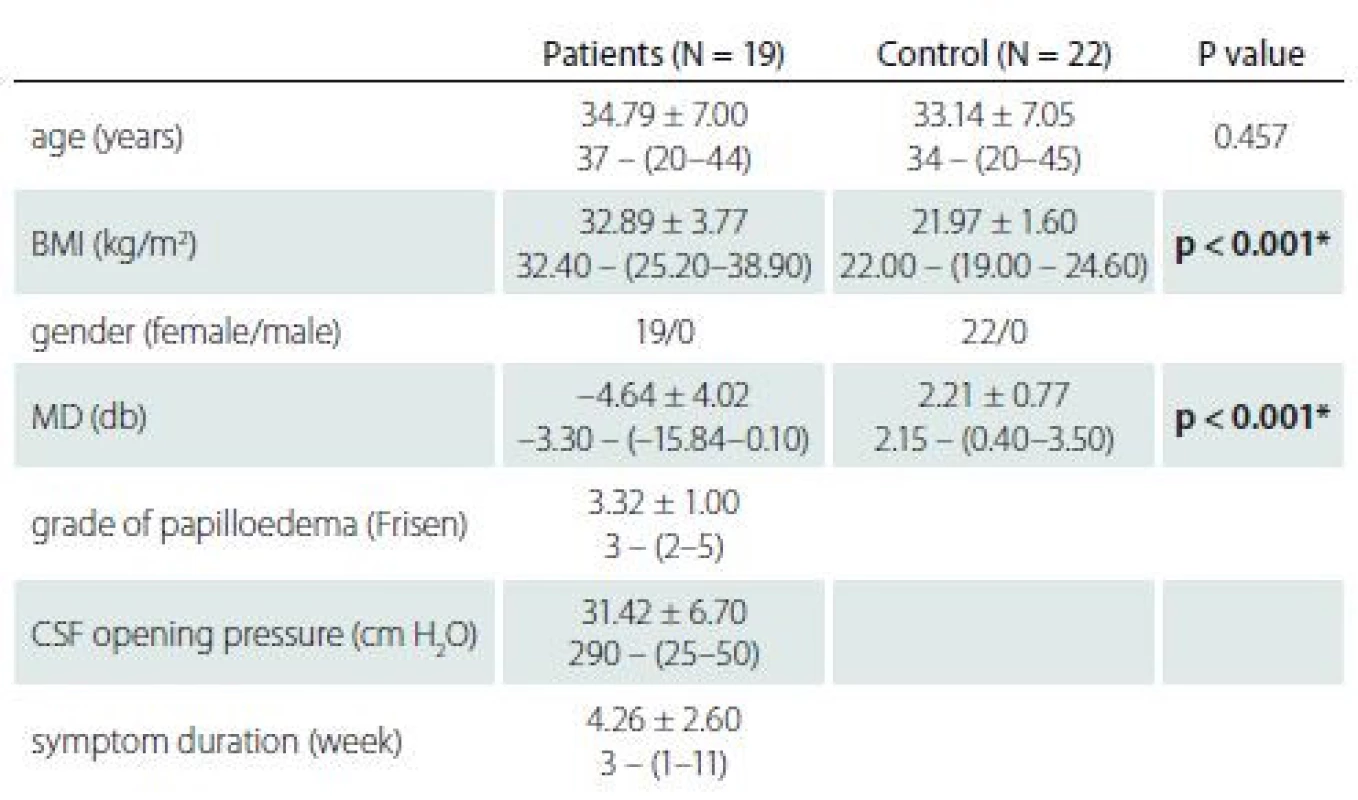
BMI – body mass index; CSF – cerebrospinal fluid; MD – mean deviation; N – number
The mean RNFL and F thicknesses were significantly higher in the patient group compared to the control group (P < 0.01). There was no statistical difference in mean GCC thickness between the patient and control groups. In the comparison of the RNFL values of the patient and control groups by quadrants, the patient group had higher values in all quadrants. In addition, there was no significant difference in disc area in the patient group compared to the control group, but there was a statistically significant difference in rim area. The median cup/ disc ratio and cup volume values were higher in the control group than in the patient group (Tab. 2).
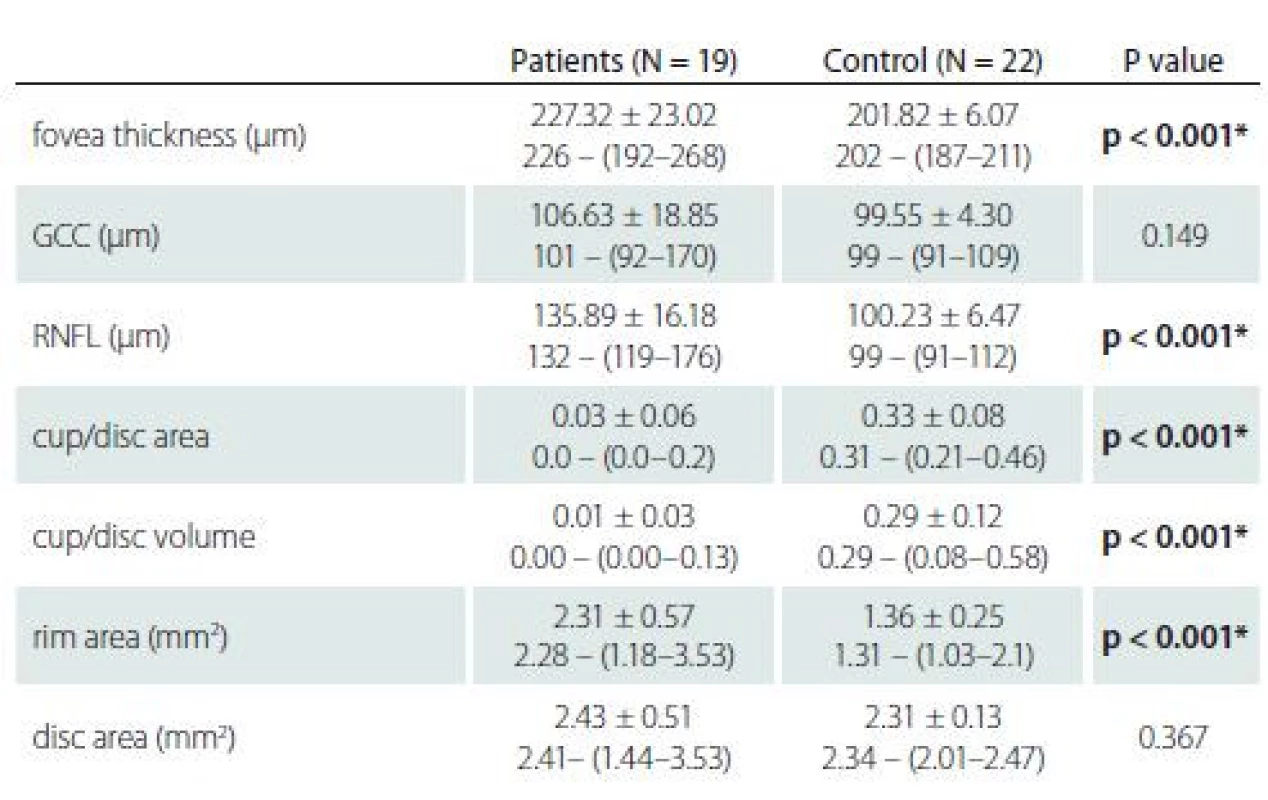
GCC – ganglion cell complex; N – number; RNFL – retinal nerve fi bre layer
There was a strong positive correlation between CSF opening pressure and Frisen score (rho = 0.869, P < 0.001). There were also moderately positive correlations between CSF opening pressure and BMI (rho = 0.653, P = 0.002) and duration of symptoms (rho = 0.458, P = 0.049). There was a moderately negative relationship between CSF opening pressure and visual field mean deviation (MD) levels (rho = –0.685, P = 0.001).
Multiple linear regression analysis was performed to determine which parameters were associated with RNFL and F thickness and to what degree. CSF opening pressure and BMI showed positive but non-significant associations with OCT parameters. The independent variables of CSF opening pressure ( = 0.205 t = 0.804) and BMI ( = 0.341 t = 1.335) were found to have positive effects on the dependent variable F thickness, at the level of 0.205 and 0.341, resp. The CSF opening pressure ( = 0.478 t = 1.817) and BMI ( = 0.141 t = 0.537) also had a positive relationship with peripapillary RNFL thickness at the 0.478 and 0.141 levels, resp.
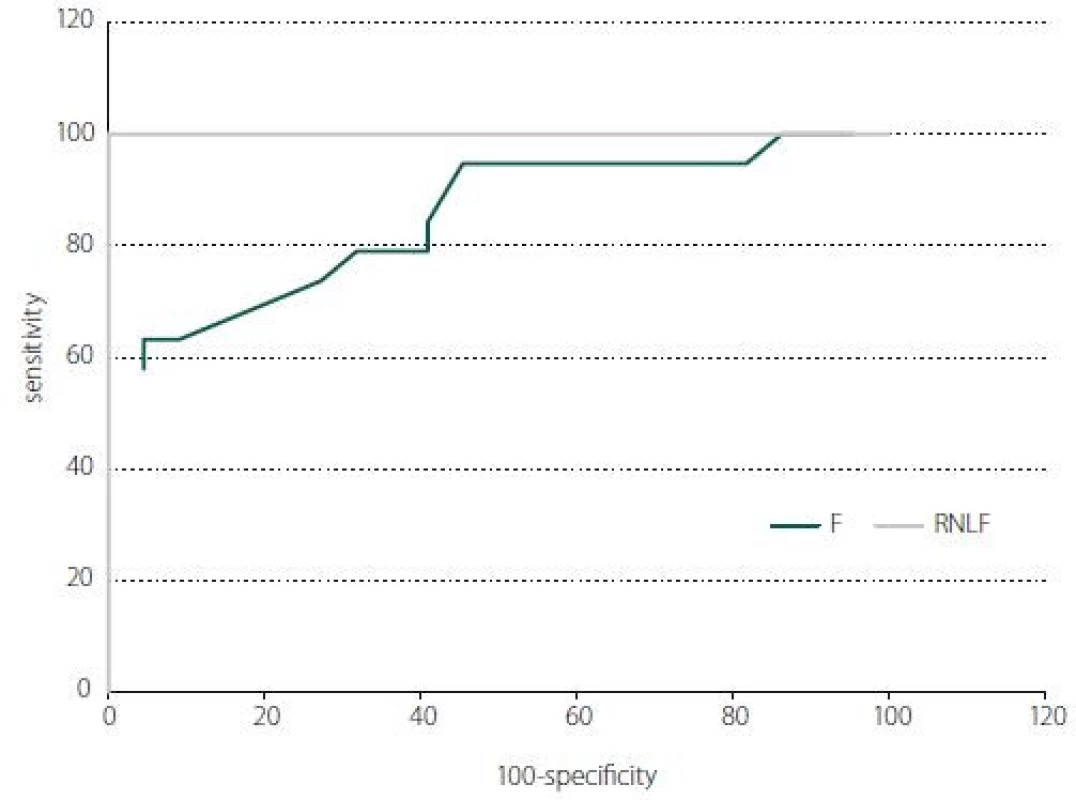
In receiver operating characteristic curve analysis, the RNFL and F thicknesses were significant parameters in the prediction of IIH (P < 0.001). Areas under the curve were 1.00 for RNLF and 0.852 for F thickness (Fig. 4).
Obr. 4. Křivka ROC průměrné tloušťky RNFL a makuly (F; v centru 1 mm) pro rozpoznání
IIH. Při mezní hodnotě 117,5 μm lze podle průměrné RNFL rozlišit IIH se 100% citlivostí
a 100% specifičností. Při mezní hodnotě 209,5 μm lze podle průměrné tloušťky F rozlišit
IIH s 63,1% citlivostí a 95,5% specifi čností.
F – fovea; IIH – idiopatická intrakraniální hypertenze; RNFL – vrstva nervových vláken sítnice
Discussion
In our study, the mean of RNFL and F thickness were found to be high in newly diagnosed and untreated IHH patients. Increased peripapillary retinal thickness measured by OCT is closely associated with increased ICP in newly diagnosed IIH patients. Therefore, OCT could be a valuable diagnostic test in the very subjective assessment of papilloedema in patients suspected of having IIH. On the other hand, in our study GCC thickness was not found to be statistically different from the control group as previously reported. Our findings are consistent with a previous study carried out on female series with IIH in which the authors reported increased average RNFL thickness in patients compared with the controls. Their mean average RNFL thickness (130.16 ± 46.40 μm) was lower than that in the present study (135.89 ± 16.18 μm), which may be due to papilloedema grade (median grade of 2.0 vs. 3.0 in the present study) [13]. The difference may also be related to the fact that they performed LP 3–4 days before OCT, unlike in our study.
Skau et al evaluated diagnostic OCT as a marker of CSF opening pressure in patients with IIH. The study comprised 20 newly diag-
nosed IIH patients, 21 long-term IIH patients and 20 healthy controls. Their results showed that increased peripapillary retinal thickness measured by OCT was associated with elevated ICP in newly diagnosed IIH patients. OCT may therefore serve as a valuable supplement for subjective papilloedema assessment in patients with IIH. These findings suggest that OCT may help to determine the severity of ICP in addition to facilitating the diagnosis of papilloedema in the acute phase. However, for long-term IIH patients who have previously been treated, OCT appears to be of limited value [14].
In some studies, including mixed groups of acute and chronic patients, RNFL thickness was reported to be similar to the control group [15]. In accordance with previous studies in literature, we found a correlation between CSF opening pressure and Friesen score, RNFL and F thickness at 1 mm [16–18]. We also found a negative correlation between visual field MD value and CSF opening pressure. We believe that these findings in OCT can help clinicians to predict CSF opening pressure before LP in early IIH. Discrepant results between studies may be related to the heterogeneity of patients and the timing of LP. In the study performed by Heckman et al [19], LP was performed before OCT. Anticipating that OCT findings may be altered due to the decrease in CSF pressure following LP; we also performed LP at least 24 h after OCT in our study. It is well known that there may be temporary improvement of IIH symptoms immediately after LP; a post-LP headache suggests that the puncture can transiently lower CSF pressure. Furthermore, there is evidence that RNFL thickness can decrease after LP [20].
Body mass index and weight gain as a function over the last year increase the risk of IIH development. BMI > 40 kg/ m2 has been shown to increase the risk of IIH-induced vision loss [21]. Berdahl et al demonstrated a linear relationship between BMI and CSF opening pressure [22]. They showed that a BMI of 18–39 resulted in a 37.7% increase in CSF opening pressure. Consistent with their results, we observed a moderately positive correlation between CSF opening pressure and BMI (r = 0.653, P = 0.02). Our regression analysis revealed that each 1 cm H2O increment in CSF opening pressure increased mean RNFL and F thickness by 0.478 μm and 0.205 μm, resp.
Labib and Rebolleda reported that every 10 μm increase in mean RNFL thickness corresponded to declines in visual field MD of 0.56 and 0.60 dB, resp. [13,16]. Consistent with their results, in the present study we detected a moderate negative correlation (rho = –0.685, P = 0.001) between CSF opening pressure and visual field MD value.
One strength of our study was that all patients were enrolled when the clinical diagnosis was new, before any therapy was initiated. In order to prevent loss of vision it is essential to recognize the symptoms and identify these patients in the early stages. Furthermore, CSF pressure was measured during the same hospital stay as the OCT assessments. This allowed us to analyze the retinal sequelae of elevated CSF pressure and papilloedema early in the course of the disease. The limitations of the present study are the small population size and unknown interval from disease onset to study inclusion. As IIH is a relatively infrequent clinical entity, large numbers of qualified patients are difficult to recruit at one centre.
The main limitation of OCT is that it analyzes structure rather than function and therefore, there is approximately a 2-week lag between optic nerve damage and visible thinning of the GCC, which can potentially limit its utility at a patient’s initial presentation [23,24]. The current study showed that the papilloedema grade correlated significantly with the average initial RNFL thickness but not with the average GCC thickness. We attributed the lack of a difference in GCC thickness between newly diagnosed IIH patients and controls to the fact that none of our patients exhibited macular oedema or optic atrophy. We believe that this may be related to the disease stage.
In conclusion, our study confirms that OCT is a non-invasive, quantitative method for detecting papilloedema in IIH patients. Increased peripapillary retinal thickness measured by OCT is closely associated with increased ICP in newly diagnosed IIH patients. Therefore, OCT could be a valuable diagnostic test in the very subjective assessment of papilloedema in patients suspected of having IIH.
The authors declare they have no potential conflicts of interest concerning drugs, products,or services used in the study.
Accepted for review: 9. 1. 2019
Accepted for print: 24. 4. 2019
The Editorial Board declares that the manuscript met the ICMJE “uniform requirements” for biomedical papers.
Faith Aslan, MD, Assist. Prof.
Alaaddin Keykubat University
Education and Research Hospital
Department of Ophthalmology
Oba Mahallesi, Fidanlık Cd.
074 00 Antalya
Turkey
e-mail: fatih.aslan@alanya.edu.tr
Sources
1. Ball AK, Clarke CE. Idiopathic intracranial hypertension. Lancet Neurol 2006; 5(5): 433–442. doi: 10.1016/ S1474-4422(06)70442-2.
2. Kupersmith MJ, Sibony P, Madel G et al. Optical coherence tomography of the swollen optic nerve head: deformation of the peripapillary retinal pigment epithelium layer in papilledema. Invest Ophthalmol Vis Sci 2011; 52(9): 6558–6564. doi: 10.1167/ iovs.10-6782.
3. Auinger P, Durbin M, Feldon S et al. Baseline OCT measurements in the idiopathic intracranial hypertension treatment trial, part I: quality control, comparisons, and variability. Invest Ophthalmol Vis Sci 2014; 55(12): 8180–8188. doi: 10.1167/ iovs.14-14960.
4. Chen JJ, Thurtell M, Longmuir RA et al. Causes and prognosis of visual acuity loss at the time of initial presentation in idiopathic intracranial hypertension. Invest Ophthalmol Vis Sci 2015; 56(6): 3850–3859. doi: 10.1167/ iovs.15-16450.
5. Albrecht P, Blasberg C, Lukas S et al. Retinal pathology in idiopathic moyamoya angiopathy detected by optical coherence tomography. Neurology 2015; 85(6): 521–527. doi: 10.1212/ WNL.0000000000001832.
6. Kaufhold F, Kadas EM, Schmidt C et al. Optic nerve head quantification in idiopathic intracranial hypertension by spectral domain OCT. PLoS One 2012; 7(5): e36965. doi: 10.1371/ journal.pone.0036965.
7. Hartmann CJ, Klistorner AI, Brandt AU et al. Axonal damage in papilledema linked to idiopathic intracranial hypertension as revealed by multifocal visual evoked potentials. Clin Neurophysiol 2015; 126(10): 2040–2041. doi: 10.1016/ j.clinph.2014.12.014.
8. Ringelstein M, Albrecht P, Kleffner I et al. Retinal pathology in Susac syndrome detected by spectral-domain optical coherence tomography. Neurology 2015; 85(7): 610–618. doi: 10.1212/ WNL.0000000000001
852.
9. Albrecht P, Müller AK, Südmeyer M et al. Optical coherence tomography in parkinsonian syndromes. PLoS One 2012; 7(4): e34891. doi: 10.1371/ journal.pone.0034891.
10. Sengupta P, Dutta K, Ghosh S et al. Optical coherence tomography findings in patients of parkinson‘s disease: an Indian perspective. Ann Indian Acad Neurol 2018; 21(2): 150–155. doi: 10.4103/ aian.AIAN_152_18.
11. Poroy C, Yücel AA. Optical coherence tomography: is really a new biomarker for alzheimer‘s disease? Ann Indian Acad Neurol 2018; 21(2): 119–125. doi: 10.4103/ aian.AIAN_368_17.
12. Friedman DI, Liu GT, Digre KB. Revised diagnostic criteria for the pseudotumor cerebri syndrome in adults and children. Neurology 2013; 81(13):1159–1165. doi: 10.1212/ WNL.0b013e3182a55f17.
13. Labib DM, Abdel Raouf DH. Diagnostic value of optic coherence tomography in patients with idiopathic intracranial hypertension. Egypt J Neurol Psychiatry Neurosurg 2015; 52(4): 249–253. doi: 10.4103/ 1110-1083.170656.
14. Skau M, Yri H, Gerds T et al. Diagnostic value of optical coherence tomography for intracranial pressure in idiopathic intracranial hypertension. Graefes Arch Clin Exp Ophthalmol 2013; 251(2): 567–574. doi: 10.1007/ s00417-012-2039-z.
15. Huang-Link YM, Al-Hawasi A, Oberwahrenbrock T et al.
OCT measurements of optic nerve head changes in idiopathic intracranial hypertension. Clin Neurol Neurosurg 2015; 130 : 122–127. doi: 10.1016/ j.clineuro.2014.12.021.
16. Rebolleda G, Muñoz-Negrete FJ. Follow-up of mild papilledema in idiopathic intracranial hypertension with optical coherence tomography. Invest Ophthalmol Vis Sci 2009; 50(11): 5197–5200. doi: 10.1167/ iovs.08-2528.
17. Eren Y, Kabatas N, Guven H et al. Evaluation of optic nerve head changes with optic coherence tomography in patients with idiopathic intracranial hypertension. Acta Neurol Belg 2018. doi: 10.1007/ s13760-018-1000-2.
18. Auinger P, Durbin M, Feldon S et al. Baseline OCT measurements in the idiopathic intracranial hypertension treatment trial, part II: correlations and relationship to clinical features. Invest Ophthalmol Vis Sci 2014; 55(12): 8173–8179. doi: 10.1167/ iovs.14-14961.
19. Heckman JG, Weber M, Junemann AG et al. Laser scanning tomography of the optic nerve vs CSF opening pressure in idiopathic intracranial hypertension. Neurology 2004; 62(7): 1221–1223.
20. Kupersmith MJ, Sibony P, Mandel G et al. Optical coherence tomography of the swollen optic nerve head: deformation of the peripapillary RPE layer in papilledema. Invest Ophthalmol Vis Sci 2011; 52(9): 6558–6564. doi: 10.1167/ iovs.10-6782.
21. Subramaniam S, Fletcher WA. Obesity and weight loss in idiopathic intracranial hypertension: a narrative review. J Neuroophthalmol 2017; 37(2): 197–205. doi: 10.1097/ WNO.0000000000000448.
22. Berdahl JP, Fleischman D, Zaydlarova J et al. Body mass index has a linear relationship with cerebrospinal fluid pressure. Investig Ophthalmol Vis Sci 2012; 53(3): 1422–1427. doi: 10.1167/ iovs.11-8220.
23. Sinclair AJ, Burdon MA, Nightingale PG et al. Rating papillilloedema: an evaluation of the Frisen classification in idiopathic intracranial hypertension. J Neurol 2012; 259(7): 1406–1412. doi: 10.1007/ s00415-011-63
65-6.
24. Kanamori A, Nakamura M, Yamada Y et al. Longitudinal study of retinal nerve fiber layer thickness and ganglion cell complex in traumatic optic neuropathy. Arch Ophthamol 2012; 130(8): 1067–1069. doi: 10.1001/ archophthalmol.2012.470.
Labels
Paediatric neurology Neurosurgery NeurologyArticle was published in
Czech and Slovak Neurology and Neurosurgery

2019 Issue 3
- Memantine Eases Daily Life for Patients and Caregivers
- Possibilities of Using Metamizole in the Treatment of Acute Primary Headaches
- Memantine in Dementia Therapy – Current Findings and Possible Future Applications
- Advances in the Treatment of Myasthenia Gravis on the Horizon
-
All articles in this issue
- Neuromuscular diseases and pregnancy
- Are late complications of Parkinson’s disease really late? YES
- Are late complications of Parkinson’s disease really late? NO
- Are late complications of Parkinson’s disease really late? COMMENT
- Obstructive sleep apnea and cerebral blood flow
- Brief analysis of the frequency of use and spectrum of animal models in stroke research
- Factors affecting the school life of children with epilepsy
- Circadian system disturbances in Huntington’s disease – implications for light therapy
- Experiences with an electrophysiological diagnosis of occupational ulnar nerve lesions at elbow
- Coin in the Hand Test for detection of malingering memory impairment in comparison with mild cognitive impairment and mild dementia in Alzheimer‘s disease
- Neuropathic pain component in patients with myotonic dystrophy type 2 – a pilot study
- Can endarterectomy of the external carotid artery be beneficial? A critical overview
- Inpatient multidisciplinary rehabilitation programme for postural and gait stability in Huntington’s disease – a pilot study
- Optical coherence tomography measurements of the optic nerve head and retina in newly diagnosed idiopathic intracranial hypertension without loss of vision
- Equivalence of Montreal Cognitive Assessment alternate forms
- Frameless and fiducial-less method for deep brain stimulation
- Effect of vacuum-compression therapy for carpal tunnel syndrome as a part of physiotherapy – pilot study
- Anterior choroidal artery aneurysm
- Czech and Slovak Neurology and Neurosurgery
- Journal archive
- Current issue
- About the journal
Most read in this issue
- Coin in the Hand Test for detection of malingering memory impairment in comparison with mild cognitive impairment and mild dementia in Alzheimer‘s disease
- Neuromuscular diseases and pregnancy
- Optical coherence tomography measurements of the optic nerve head and retina in newly diagnosed idiopathic intracranial hypertension without loss of vision
- Effect of vacuum-compression therapy for carpal tunnel syndrome as a part of physiotherapy – pilot study
