-
Články
- Časopisy
- Kurzy
- Témy
- Kongresy
- Videa
- Podcasty
Genetic Architecture of a Reinforced, Postmating, Reproductive Isolation Barrier between Species Indicates Evolution via Natural Selection
A role for natural selection in reinforcing premating barriers is recognized, but selection for reinforcement of postmating barriers remains controversial. Organisms lacking evolvable premating barriers can theoretically reinforce postmating isolation, but only under restrictive conditions: parental investment in hybrid progeny must inhibit subsequent reproduction, and selected postmating barriers must restore parents' capacity to reproduce successfully. We show that reinforced postmating isolation markedly increases maternal fitness in the fungus Neurospora crassa, and we detect the evolutionary genetic signature of natural selection by quantitative trait locus (QTL) analysis of the reinforced barrier. Hybrid progeny of N. crassa and N. intermedia are highly inviable. Fertilization by local N. intermedia results in early abortion of hybrid fruitbodies, and we show that abortion is adaptive because only aborted maternal colonies remain fully receptive to future reproduction. In the first QTL analysis of postmating reinforcement in microbial eukaryotes, we identify 11 loci for abortive hybrid fruitbody development, including three major QTLs that together explain 30% of trait variance. One of the major QTLs and six QTLs of lesser effect are found on the mating-type determining chromosome of Neurospora. Several reinforcement QTLs are flanked by genetic markers showing either segregation distortion or non-random associations with alleles at other loci in a cross between N. crassa of different clades, suggesting that the loci also are associated with local effects on same-species reproduction. Statistical analysis of the allelic effects distribution for abortive hybrid fruitbody development indicates its evolution occurred under positive selection. Our results strongly support a role for natural selection in the evolution of reinforced postmating isolation in N. crassa.
Published in the journal: Genetic Architecture of a Reinforced, Postmating, Reproductive Isolation Barrier between Species Indicates Evolution via Natural Selection. PLoS Genet 7(8): e32767. doi:10.1371/journal.pgen.1002204
Category: Research Article
doi: https://doi.org/10.1371/journal.pgen.1002204Summary
A role for natural selection in reinforcing premating barriers is recognized, but selection for reinforcement of postmating barriers remains controversial. Organisms lacking evolvable premating barriers can theoretically reinforce postmating isolation, but only under restrictive conditions: parental investment in hybrid progeny must inhibit subsequent reproduction, and selected postmating barriers must restore parents' capacity to reproduce successfully. We show that reinforced postmating isolation markedly increases maternal fitness in the fungus Neurospora crassa, and we detect the evolutionary genetic signature of natural selection by quantitative trait locus (QTL) analysis of the reinforced barrier. Hybrid progeny of N. crassa and N. intermedia are highly inviable. Fertilization by local N. intermedia results in early abortion of hybrid fruitbodies, and we show that abortion is adaptive because only aborted maternal colonies remain fully receptive to future reproduction. In the first QTL analysis of postmating reinforcement in microbial eukaryotes, we identify 11 loci for abortive hybrid fruitbody development, including three major QTLs that together explain 30% of trait variance. One of the major QTLs and six QTLs of lesser effect are found on the mating-type determining chromosome of Neurospora. Several reinforcement QTLs are flanked by genetic markers showing either segregation distortion or non-random associations with alleles at other loci in a cross between N. crassa of different clades, suggesting that the loci also are associated with local effects on same-species reproduction. Statistical analysis of the allelic effects distribution for abortive hybrid fruitbody development indicates its evolution occurred under positive selection. Our results strongly support a role for natural selection in the evolution of reinforced postmating isolation in N. crassa.
Introduction
The evolution of reproductive isolation between diverging lineages is a critical step in speciation. Most reproductive isolation barriers between taxa evolve as side effects of changes resulting from within-population processes, including, as Darwin recognized, natural selection [1]. Wallace reasoned that natural selection against maladaptive hybridization itself could drive the evolution of reproductive isolation barriers when taxa co-occur geographically (are sympatric) [2]. This mechanism, known as ‘the Wallace effect’, is also termed reinforcement, because preexisting reproductive isolation is ‘reinforced’ by natural selection for stronger barriers. Following an extensive correspondence with Wallace on this matter, Darwin remained skeptical [1]–[3]. Today, reinforcement of premating barriers by natural selection is widely accepted, but natural selection for reinforced postmating isolation still remains controversial [4]–[6].
Theoretically, reinforcement of postmating barriers can occur when 1) evolution of premating barriers is constrained, 2) there is substantial parental investment in the production and care of progeny, 3) individuals that are capable of mating more than once are unable to do so because the energetic costs of nurturing the unfit hybrids make subsequent reproduction less likely, and 4) reinforcement of the postmating barrier restores parents' capacity to successfully reproduce after hybridization [7]–[9].
After reinforcement, sympatric species or populations should show stronger barriers than those that are geographically separated (allopatric), because natural selection for stronger barriers only occurs when populations are overlapping. This biogeographic pattern has been observed for premating barriers in many animals, plants, and fungi where it has been investigated [6], [10], [11], but only a few instances of stronger postmating reinforcement in sympatry have been reported over the past 65 years [9], [12]–[14], including a microbial example involving abortion of hybrid fruitbodies (perithecia) in matings between sympatric populations of the haploid fungal species N. crassa and N. intermedia [15], [16].
Reproductive isolation of N. crassa and N. intermedia
The geographical ranges of N. crassa and N. intermedia are broadly overlapping, and individuals of both species can be collected from the same site [15], [17], [18]. Both species are largely outbreeding, and outbreeding is confirmed by population genetic analysis [19]–[22]. Hybrids of the two species can be obtained in laboratory crosses, but natural hybrids have not been encountered [15]. This absence may reflect the rarity of hybridization in nature, the low viability of hybrids, or both. Nevertheless, phylogenetic conflict between some gene trees and the species tree of the Neurospora genus indicates historical hybridization and introgression between N. crassa and N. intermedia [23].
In Neurospora, mating can occur only between individuals having different alleles at the mating-type locus (mat a or mat A). Under nutrient limited conditions, a haploid colony of Neurospora differentiates female reproductive structures (protoperithecia). Fertilization occurs when a specialized hypha (trichogyne) growing from a protoperithecium fuses with a cell from a colony of the opposite mating type. The attraction of trichogynes to fertilizing cells is mediated by mating-type specific pheromomones. After fertilization, nuclei from the fertilizing strain travel through the trichogyne to the protoperithecium, where karyogamy eventually occurs. A series of independent meiotic events give rise to the sexual progeny (ascospores), which develop within flask shaped fruitbodies (perithecia) on the maternal thallus. Upon maturity, the ascospores are forcibly ejected from the fruitbody.
In Neurospora, evolution of premating isolation is apparently constrained because the sequences of the mating-type–specific, peptide pheromones controlling attraction between trichogynes and fertilizing cells are conserved throughout the genus (as determined by BLAST analysis of the N. crassa, N. tetrasperma, and N. discreta genomes [24]) and even beyond [25]. Evolution of the extracellular, ligand-binding portions of mating-pheromone receptor proteins is also comparatively constrained [26]. In Neurospora, sex cells of mating-type–compatible partners usually fuse before incompatibilities are expressed, and incompatibility arises either prezygotically in the fusion cell and the subsequent dikaryotic cells that proliferate from it, or postzygotically during the meiosis that directly follows karyogamy and during the formation and development of the ascospores [17]. Since Neurospora progeny develop within fruitbodies composed entirely of maternal tissue, the maternal colony (mycelium) bears virtually the entire cost of reproduction. Because 98% of N. crassa×N. intermedia hybrid progeny are inviable [15], and because allocation of resources to developing fruitbodies on one part of the colony abolishes the fertility of uncrossed regions of the colony [27], hybridization is severely maladaptive.
The key questions are: 1) Does abortion of hybrid fruitbodies by N. crassa make subsequent reproduction possible for the maternal colony, thereby conferring a fitness advantage? and 2) Did this postmating barrier evolved by natural selection? First we show that hybrid fruitbody abortion is adaptive, because it preserves the fertility of maternal N. crassa. Then by quantitative trait locus (QTL) analysis of hybrid fruitbody abortion and statistical analysis of the allelic effects distribution for the detected loci, we show that the genetic architecture that we observe is consistent with evolution by positive natural selection.
Results
Abortion of hybrid fruitbodies is adaptive
We tested whether female fertility of colonies was preserved after abortion of sympatric hybrid fruitbodies in sequential mating experiments between the two Neurospora species. N. crassa colonies were grown in Petri plates on synthetic cross agar medium, which promotes sexual reproduction. One half of the receptive N. crassa colony was fertilized by either an allopatric or sympatric N. intermedia strain, and the effect of allopatric vs. sympatric fertilization on the reproductive success of subsequent conspecific fertilization on another portion of the maternal colony was assayed. Initial fertilizations by a conspecific strain or with water (pseudo-fertilizations) were also performed as controls. Each of the four initial-fertilization treatments (allopatric male, sympatric male, conspecific male, pseudo-fertilization) was replicated three times. Following Dettman, et al., reproductive success was scored on a seven-category scale incorporating fruitbody development and quality of ejected ascospores, if any [15]. The N. crassa and N. intermedia strains used are described in the Materials and Methods and listed in Table 1. In all sequential matings, both the maternal strain and conspecific fertilizing strains were N. crassa from the NcC clade endemic to India, hereafter referred to as NcC-India [15].
Tab. 1. Strains of Neurospora used in this study. 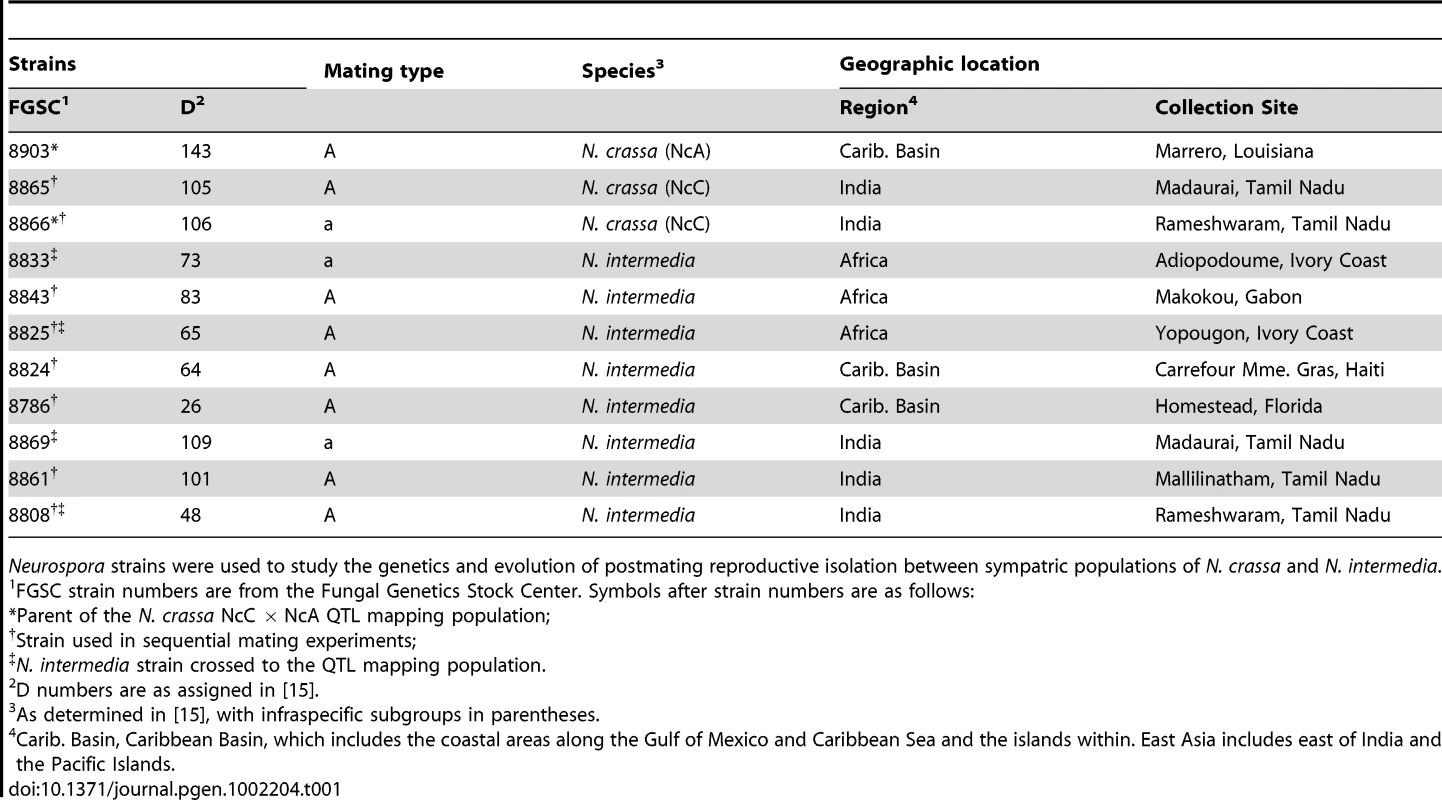
Neurospora strains were used to study the genetics and evolution of postmating reproductive isolation between sympatric populations of N. crassa and N. intermedia. Fruitbody development on portions of the maternal colony fertilized by allopatric N. intermedia strains is normal and results in ascospore ejection, although a majority of the hybrid ascospores are unmelanized and inviable (reproductive success score (RSS) = 4.33±0.14, Figure 1). Following allopatric hybridization, response to conspecific fertilization at the second time point is completely inhibited (RSS = 0.00±0.00).
Fig. 1. Maternal fitness of sequentially mated Neurospora. 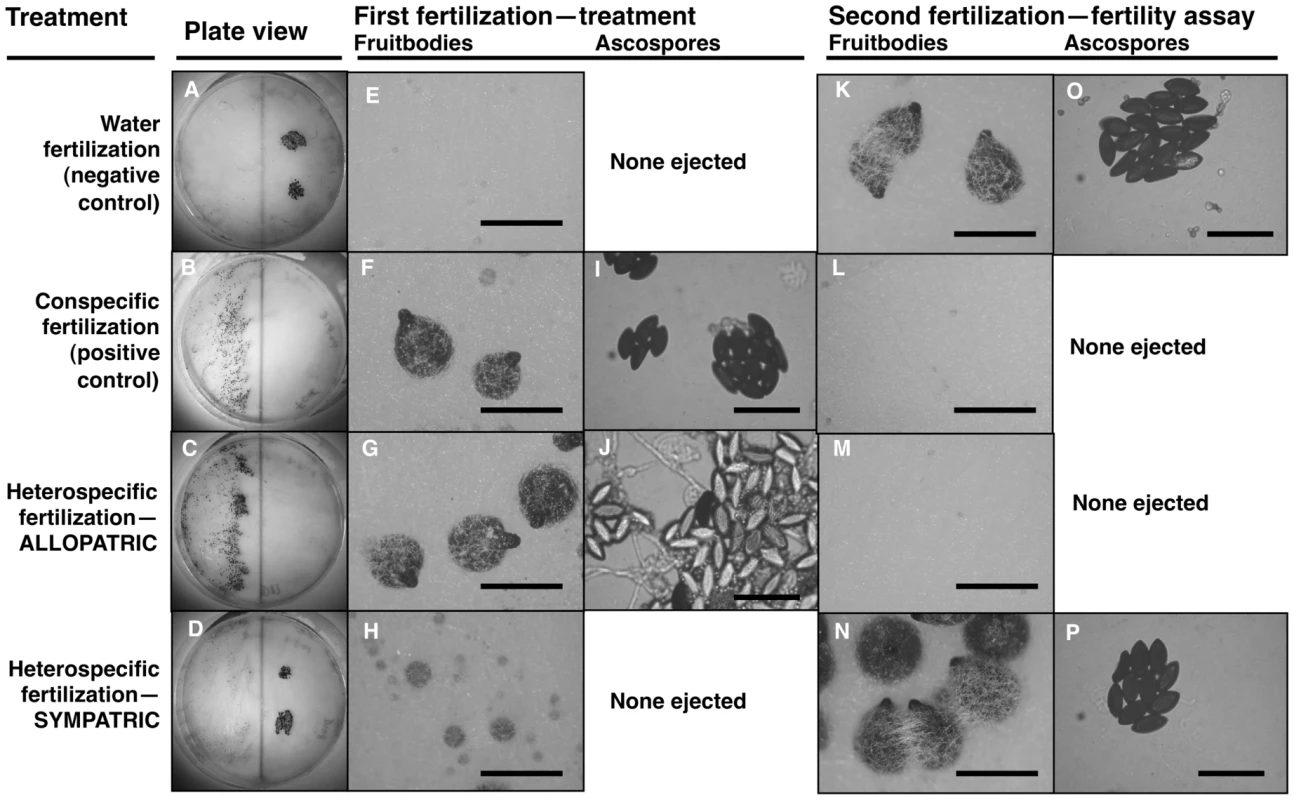
To determine the effect of hybrid matings on subsequent conspecific matings, receptive N. crass NcC-India cultures were initially fertilized in four different ways: distilled water as a negative control (A, E, K, O); N. crassa NcC-India as a conspecific positive control (B, F, I, L); N. intermedia allopatric to N. crassa NcC-India (C, G, J, M); N. intermedia sympatric to N. crassa NcC-India (D, H, N, P). In all experiments, the second fertilizing strain was an N. crassa NcC-India. The photographs show: whole plates (A–D), typical fruitbody development (E–H, K–N; bar = 500 µm) and ejected ascospores, if any (I, J, O, P; bar = 50 µm), resulting from the first and second fertilizations. Note that the conspecific second fertilizations resulted in ascospore production only when the initial heterospecific partner was a sympatric strain or when the initial fertilization was a water control (P and O, respectively). Second-fertilization sexual development was completely inhibited after initial fertilization by allopatric heterospecifics or by the conspecific postitive control (M and L, respectively). The clear ascospores in J are inviable hybrid progeny typical of crosses between allopatric strains of N. crassa and N. intermedia. In contrast, fertilization by sympatric N. intermedia strains at the first time point yields only aborted fruitbodies (RSS = 1.00±0.00), but the subsequent conspecific matings are fully fertile (RSS = 6.00±0.00, Table 2). We performed semi-parametric regression using a proportional hazards survival model [28] to examine the effects of fertilization at the first time point (water control, conspecific control, or allopatric or sympatric heterospecific) on progression through the sexual cycle after fertilization at the second time point (measured as RSS). The first–time-point fertilization treatment had a significant effect (P<0.0028), whereas the nested effects of geographic origin and strain identity of the first–time-point male do not have significant effects (Table 3). We conclude that abortion of hybrid fruitbodies is selectively advantageous because abortion preserves maternal fertility of the colony after hybridization.
Tab. 2. The effect of initial fertilization on subsequent maternal fertility in sequentially fertilized Neurospora crassa (NcC-India) colonies. 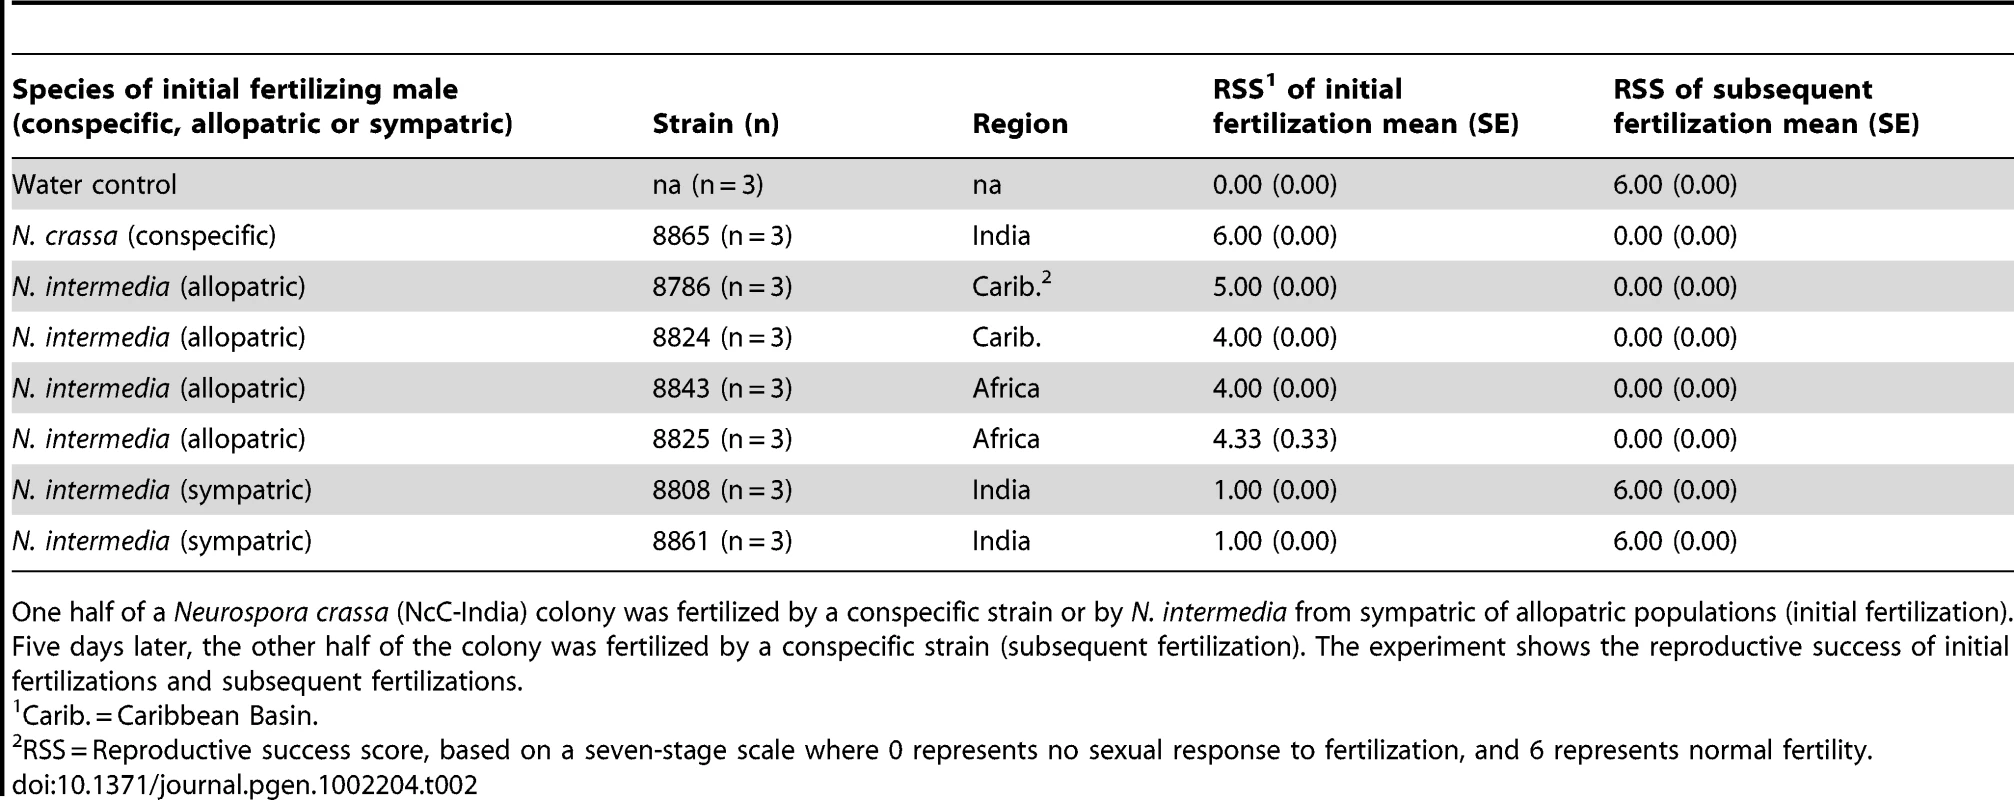
One half of a Neurospora crassa (NcC-India) colony was fertilized by a conspecific strain or by N. intermedia from sympatric of allopatric populations (initial fertilization). Five days later, the other half of the colony was fertilized by a conspecific strain (subsequent fertilization). The experiment shows the reproductive success of initial fertilizations and subsequent fertilizations. Tab. 3. Proportional hazards model of how initial fertilization affects subsequent maternal fertility of Neurospora colonies. 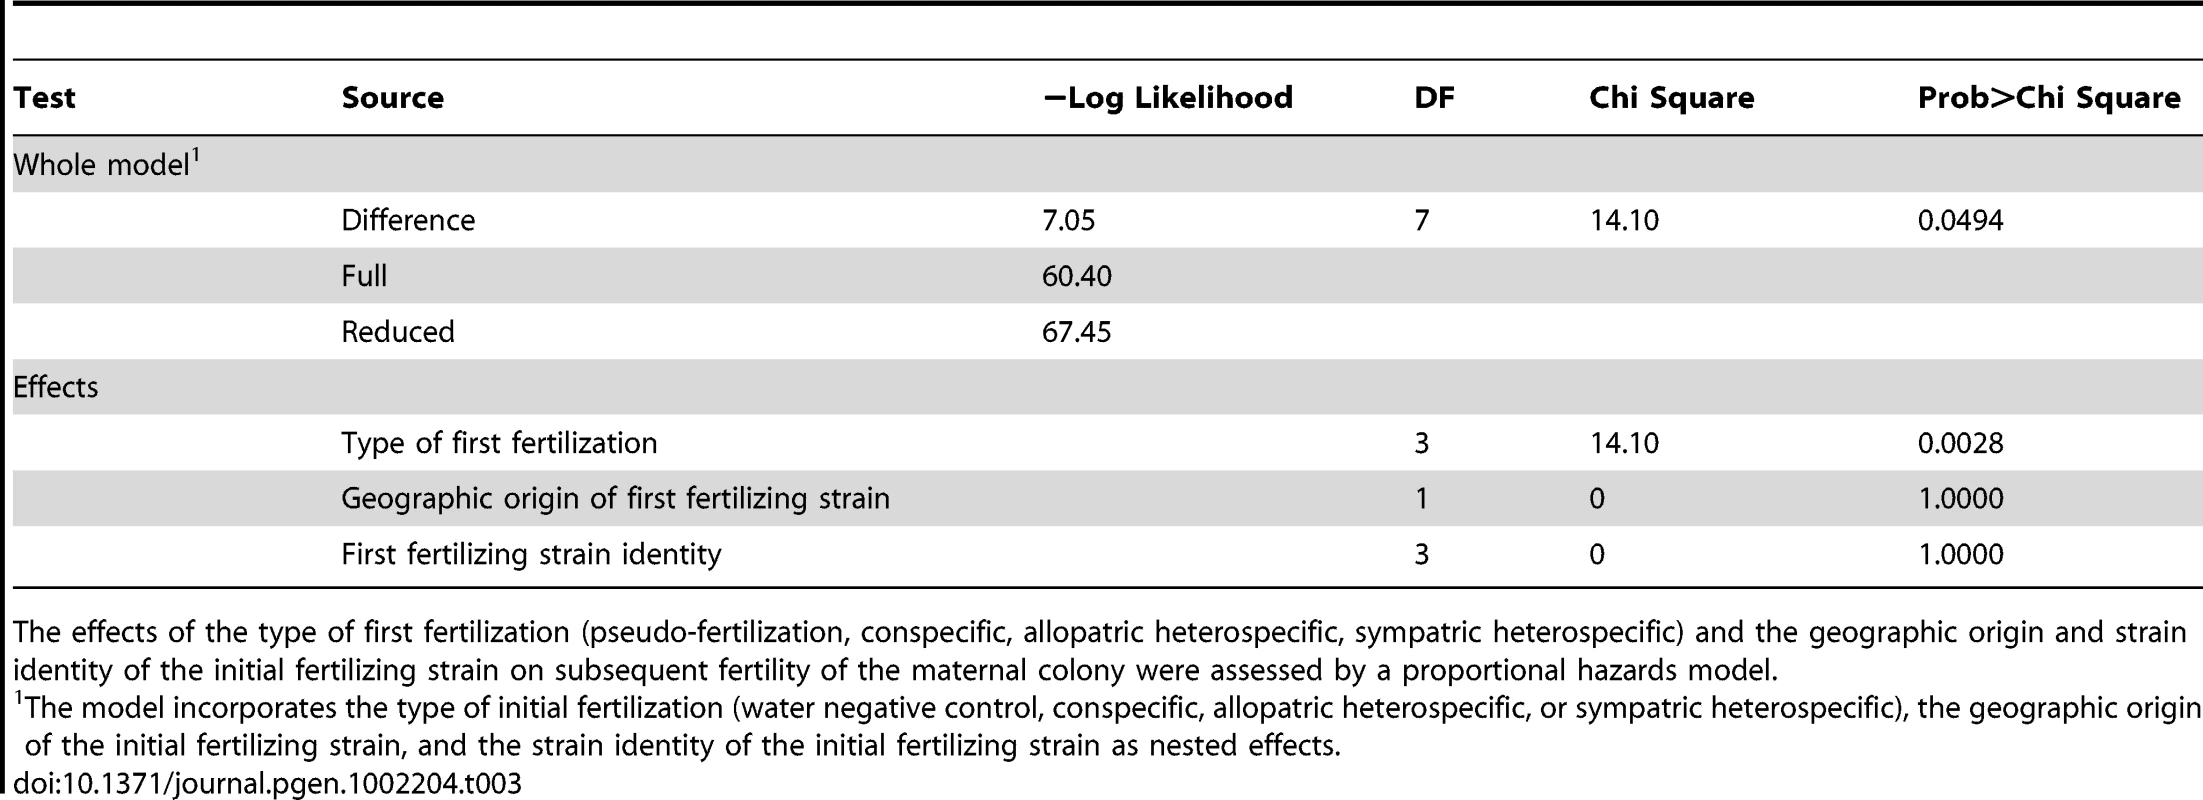
The effects of the type of first fertilization (pseudo-fertilization, conspecific, allopatric heterospecific, sympatric heterospecific) and the geographic origin and strain identity of the initial fertilizing strain on subsequent fertility of the maternal colony were assessed by a proportional hazards model. Design of QTL mapping experiments
Previous research on the genetics of reinforcement focused on premating barriers in animals [29]–[31]. Here we investigate whether the genetic architecture of a reinforced, microbial, postmating barrier is consistent with evolution by directional natural selection [32], [33]. A 500-member, N. crassa mapping population was derived from an intraspecific, inter-clade cross between the NcC-India strain FGSC 8866, and a Louisiana, USA, strain, FGSC 8903, a member of the NcA clade, hereafter referred to as NcA-Louisiana. Neurospora are hermaphroditic so that the parental strains could be mated reciprocally. Based on the identity of the maternal parent we can infer that the mapping population contains both individuals with NcA-Louisiana cytoplasm (57%) and individuals with NcC-India cytoplasm (43%).
The N. crassa mapping strains were crossed maternally and paternally to N. intermedia strains from Tamil Nadu, India, which are sympatric to the NcC-India parent and allopatric to the NcA-Louisiana parent. NcC-India aborts fruitbodies after fertilization by N. intermedia from India, but NcA-Louisiana does not [15], [16]. The mapping strains were also crossed maternally and paternally to African N. intermedia strains, which are allopatric to both the NcC-India and NcA-Louisiana parents. Neither the NcA-Louisiana parent nor the NcC-India parent aborts fruitbodies after fertilization by the African N. intermedia strain. The four traits that we studied were fruitbody development in the four different types of matings. The four types of matings are defined by the parental role of the mapping strain (maternal or paternal) and the geographic relationship of the N. intermedia strain (Indian and therefore sympatric to the NcC-India parent of the mapping population, hereafter termed “sympatric”; or African, and therefore allopatric to both the NcC-India parent and the NcA-Louisiana parent, hereafter termed “allopatric”; see Table 4). Therefore each member of the mapping population was crossed twice to an Indian N. intermedia strain and twice to an African N. intermedia strain, once with the mapping strain in the maternal role and once with the mapping strain in the paternal role, for a total of four crosses per mapping strain. We examined fruitbody development in each cross, recording its fruitbody development score (FDS) 10 days after fertilization (see Materials and Methods).
Tab. 4. Summary of hybrid fruitbody development phenotypes analyzed by QTL mapping. 
The N. crassa QTL mapping strains were crossed reciprocally to N. intermedia tester strains from India and Africa. Hybrid fruitbody development was measured in each of these four types of crosses. Linkage and segregation analysis
The mapping strains were genotyped at 69 AFLP (Table 5 and Table 6) and 28 microsatellite (Table 7) markers as well as the mat locus. A genetic map containing seven linkage groups (LG) reflecting the seven chromosomes of Neurospora was estimated, with a total map length of 837.9 cM and an average intermarker distance of 9.2 cM (Figure 2).
Fig. 2. The N. crassa clade NcA × clade NcC genetic map. 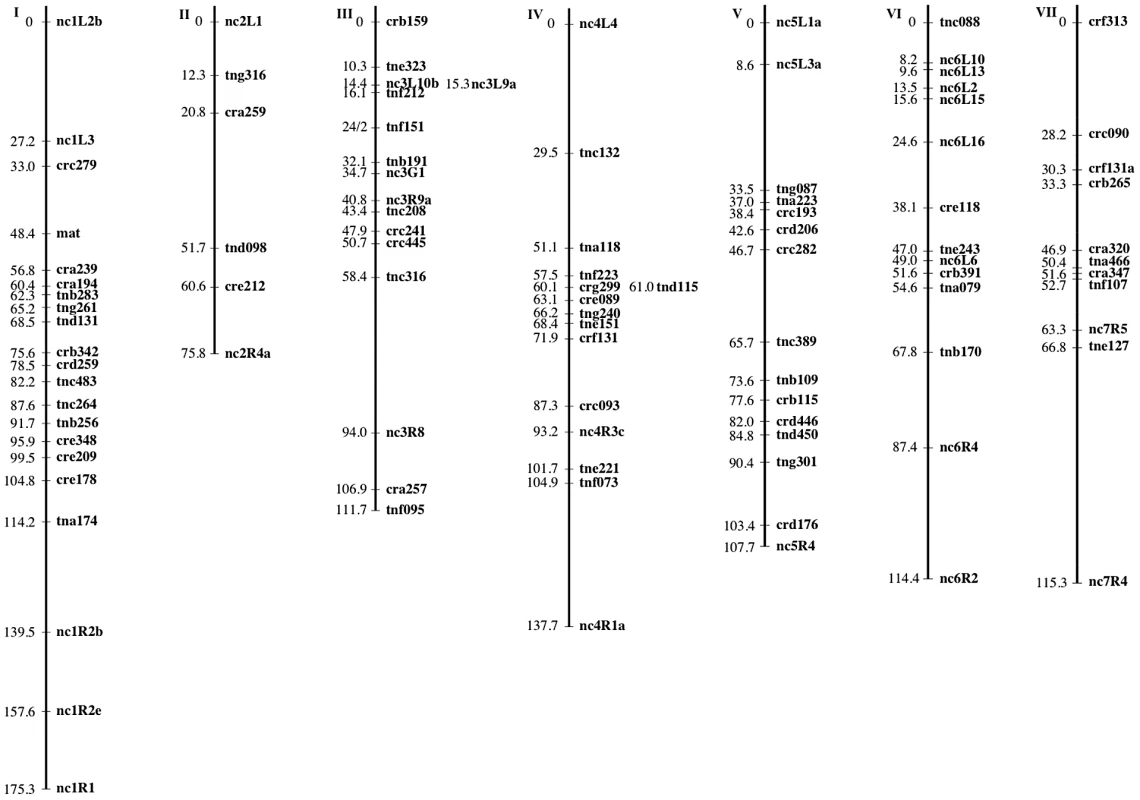
Markers are mapped to seven linkage groups reflecting the seven chromosomes of N. crassa. For each marker, its genetic position (cM) relative to the linkage group's leftmost marker is given. Marker names indicate the nature of each marker as follows: AFLP markers are named with a three-letter prefix and the estimated length of the fragment in base pairs. The prefixes “cr” and “tn” indicate whether the AFLP fragment was present in the NcA or NcC parent, respectively. The third letter in the prefix (a–h) indicates which selective primers were used to obtain the fragment. Microsatellite markers are named with the prefix “nc” followed by the number of the linkage group and (1–7) and an alphanumeric identifier preceded by “L” or “R” to reflect whether the microsatellite was targeted to the left arm or the right arm of the chromosome. Tab. 5. Primer sequences for preselective and selective AFLP primers. 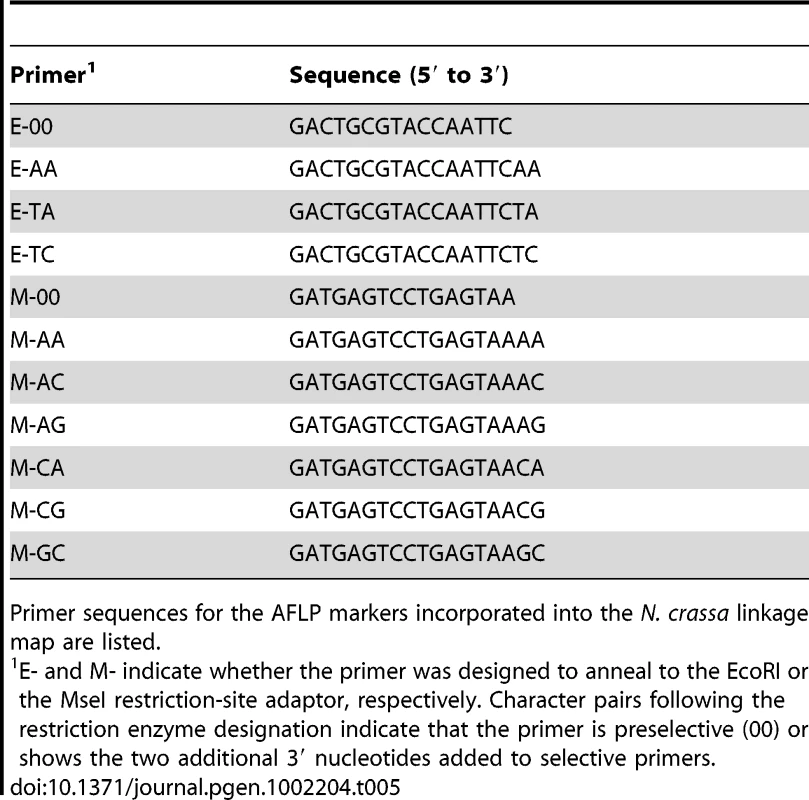
Primer sequences for the AFLP markers incorporated into the N. crassa linkage map are listed. Tab. 6. Primer pairs for preselective and selective AFLP reactions. 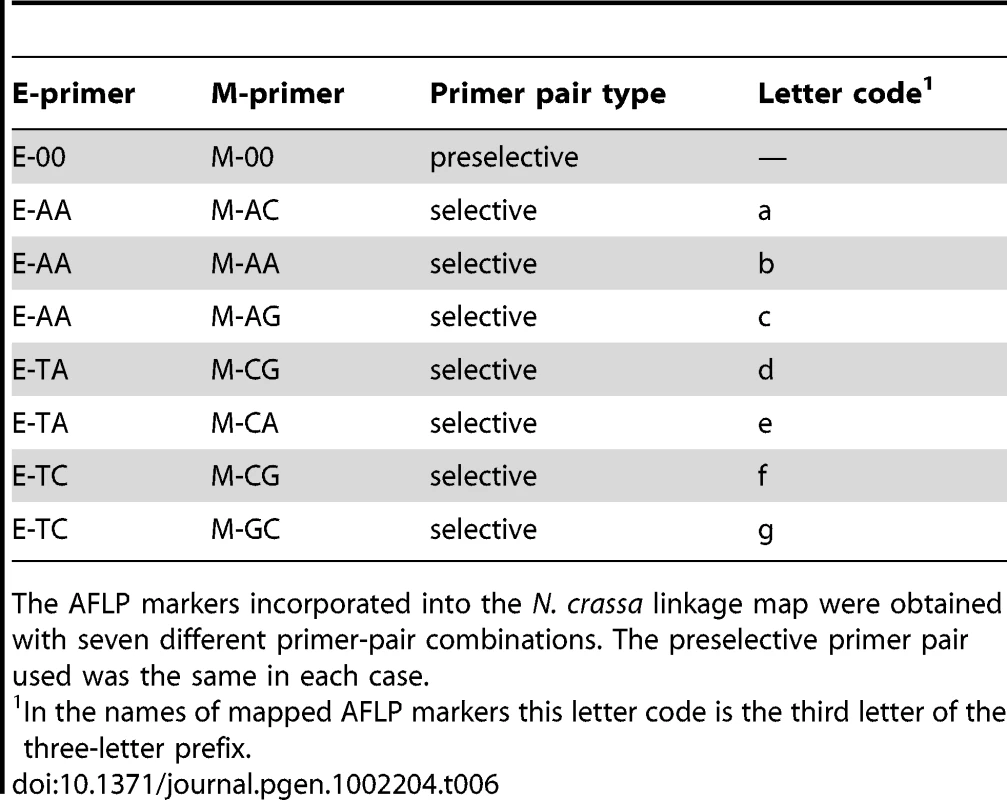
The AFLP markers incorporated into the N. crassa linkage map were obtained with seven different primer-pair combinations. The preselective primer pair used was the same in each case. Tab. 7. Microsatellite targeted markers on the Neurospora crassa linkage map. 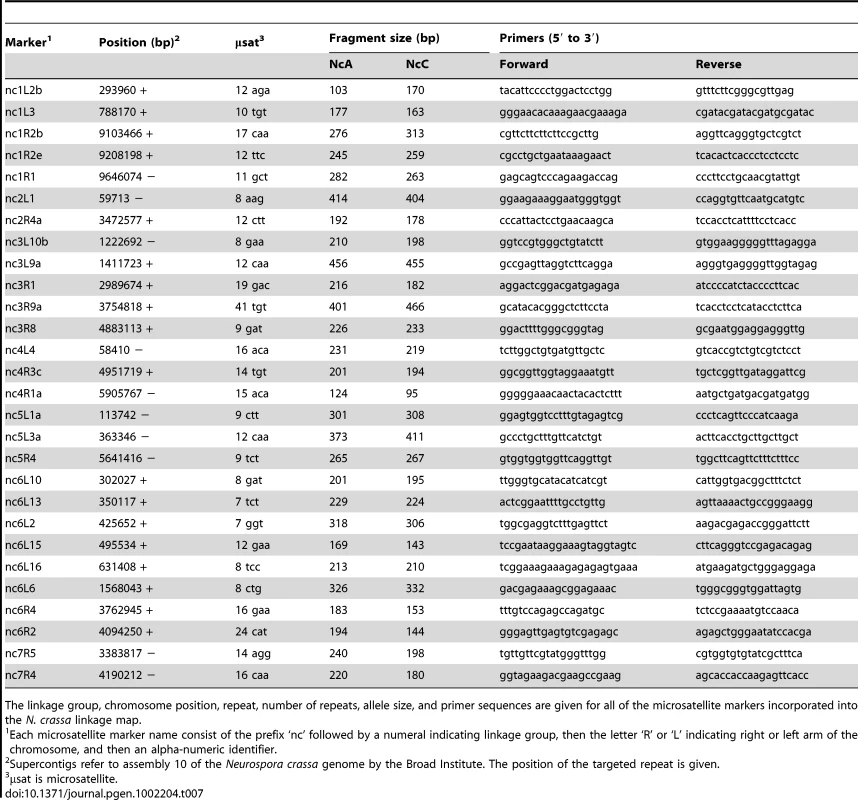
The linkage group, chromosome position, repeat, number of repeats, allele size, and primer sequences are given for all of the microsatellite markers incorporated into the N. crassa linkage map. Non-Mendelian segregation and non-random associations (NRA) among alleles at multiple loci can reflect genetic incompatibilities between the NcC and NcA genomes. Individuals in the mapping population inherited 53.6% of genotyped alleles from the NcA-Louisiana parent, and this is significantly higher than the 50% expected under Mendelian segregation (t Test, Pt = 6.8721, DF = 93<0.0001). The proportion of NcA-Louisiana alleles inherited varied across linkage groups (ANOVA, PF ratio = 23.34, DF = 93<0.0001), with linkage groups II, VI, and VII showing below 50% inheritance of NcA-Louisiana alleles (Figure 3). The skew towards NcA alleles was strongest on linkage group I, with 59.0% of marker alleles inherited from that parent. Of 22 markers showing significant segregation distortion (χ2, P<0.05), only one marker on LG IV (nc4L4) was significantly skewed in favor of the NcC-India allele, while the 21 other significantly distorted markers favored the NcA-Louisiana and were located on LG I (16 markers) and LG IV (5 markers).
Fig. 3. Segregation of mapped markers in the N. crassa NcA × NcC mapping population. 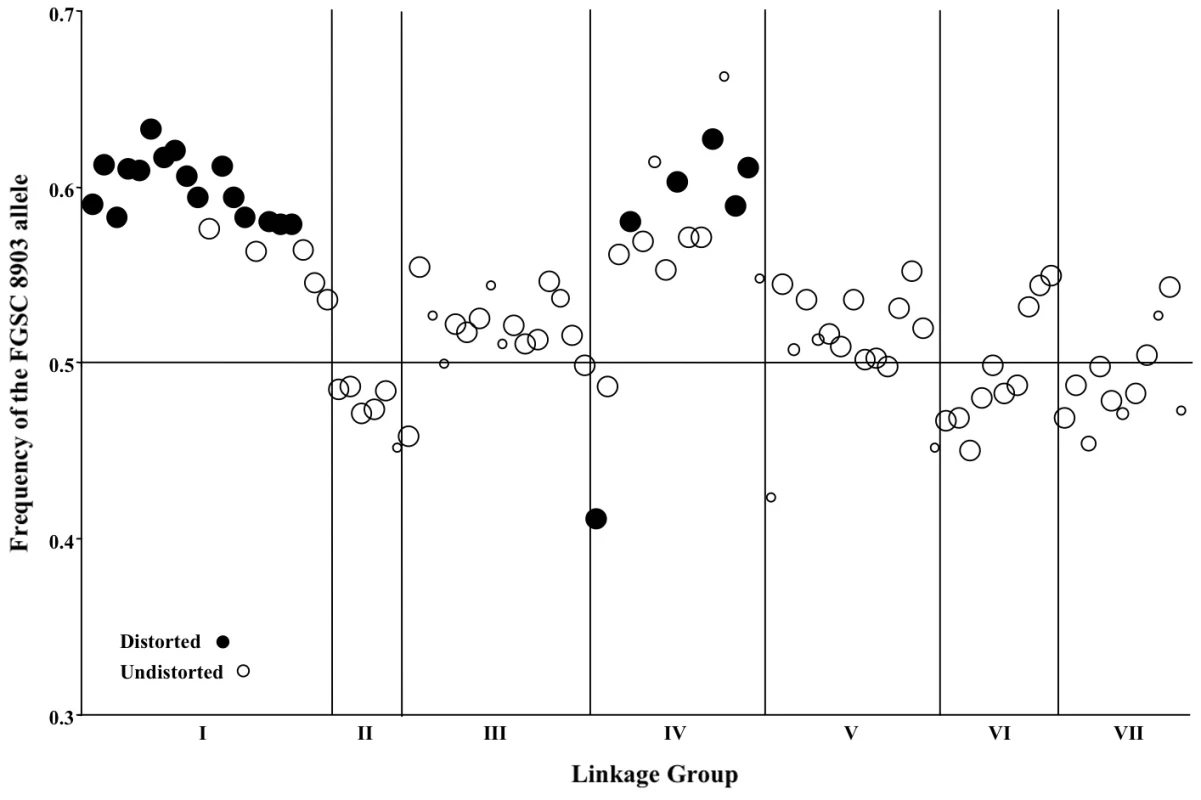
Genetic markers showing distorted (closed circles) or undistorted (open circles) segregation are ordered according to their position within the seven linkage groups on the x-axis. The size of each circle is proportional to the number of individuals in the mapping population that was genotyped for that marker, and the frequency of the NcA allele is shown on the y-axis. Four markers from linkage group VI (nc6L2, nc6L6, nc6L13, and nc6L15) were excluded because they were selectively genotyped for finer mapping. Seven marker pairs representing four pairs of linkage groups exhibit significant non-random associations (Table 8). Positive non-random associations, reflecting an overrepresentation of parental haplotypes, are consistent with the existence of negative epistasis among clade specific alleles, as predicted by the Dobzhansky-Muller (D-M) model of the evolution of genetic incompatibilities first articulated by Bateson [34]. Per this model, incompatibilities between two loci, X and Y, must arise in in a two-step fashion, as follows: Consider that at the time that the NcA and NcC clades diverged, both populations contained ancestral (anc) alleles at every locus. The first fixation of a derived allele, e.g., Xanc→XNcA, will not cause incompatibility, because XNcA arises in an ancestral genetic background and must also be compatible with the ancestral alleles that comprise the NcC genome. However the next derived allele to be fixed by either population can be a source of incompatibility because the genetic backgrounds of the two clades are no longer identical. For example, if we consider fixation of a new Y allele in the NcC population, Yanc→YNcC, we see that YNcC evolves in the presence of Xanc, and may not be compatible with the previously derived allele XNcA in the NcA clade. Conversely, fixation of a new Y allele in the NcA population, Yanc→YNcA can also give rise to incompatibilities, since YNcA need not be compatible with the Xanc allele, which is still fixed in the NcC population.”
Tab. 8. Pairs of unlinked loci showing significant non-random associations. 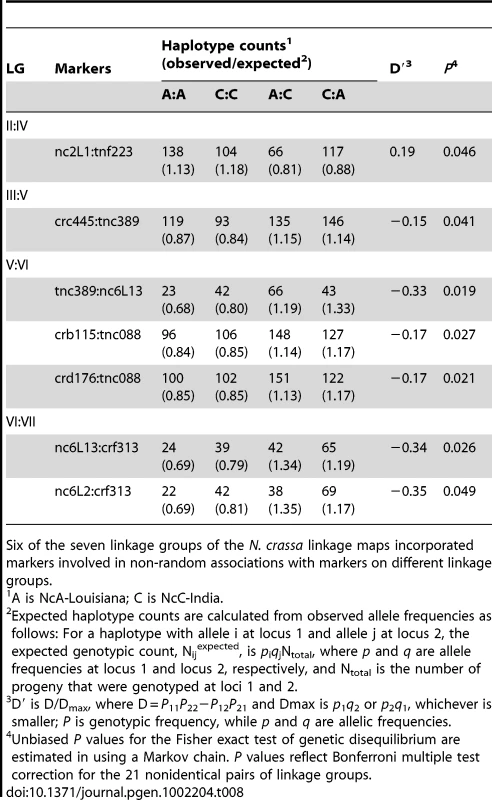
Six of the seven linkage groups of the N. crassa linkage maps incorporated markers involved in non-random associations with markers on different linkage groups. Given partial intersterility between NcA-Louisiana and NcC-India and the segregation distortion that we observed, we predicted that observed significant non-random associations would be positive, indicating a deficit of recombinant haplotypes. However, only one significant marker pair (markers nc2L1 and tnf223 from LG II and IV, respectively) showed positive non-random associations (D' = 0.19). Surprisingly, the loci on the three other significant linkage-group pairs (III and V, V and VI, and VI and VII) showed negative, non-random associations, with D' values ranging from −0.35 to −0.15, implying overrepresentation of recombinant haplotypes. Overrepresentation of recombinant haplotypes could be evidence that an optimal N. crassa genome would include some mixture of clade-specific alleles. Indeed, a population genomic study of N. crassa NcA from the Caribbean Basin and the south-eastern United States identified a haplotype in the Louisiana population consisting of a four-gene “migrant tract” originating from an unidentified, genetically diverged population or species, concluding that this tract was fixed in the Louisiana population via a selective sweep [35]. Alternatively, if alleles are not fixed in the clades, overrepresented recombinant haplotypes could be analogous to selectively advantageous, intrapopulation haplotypes.
Genetics of hybrid fruitbody abortion
We used composite interval mapping to identify QTLs for fruitbody development. The genetic basis of postmating reinforcement was revealed by mapping loci for maternal influence on sympatric fruitbody development (trait A, see Table 4). We identified 11 additive-effect QTLs for this trait (Figure 4a and Table 9; complete CIM scans for all traits are in Figure 5). Seven of the QTLs are located on LG I, including one of large effect, while LG II and V each contain a single broad QTL region of weak effect, and the left arm of LG VI harbors two other QTLs of large effect. The detected QTLs account for roughly 61% of trait variance, with the three loci of large effect accounting together for roughly 30% of trait variance. The inferred cytoplasm type (NcA-Louisiana or NcA-India) of the mapping strains did not significantly affect this trait.
Fig. 4. Genetics of hybrid fruitbody development in N. crassa. 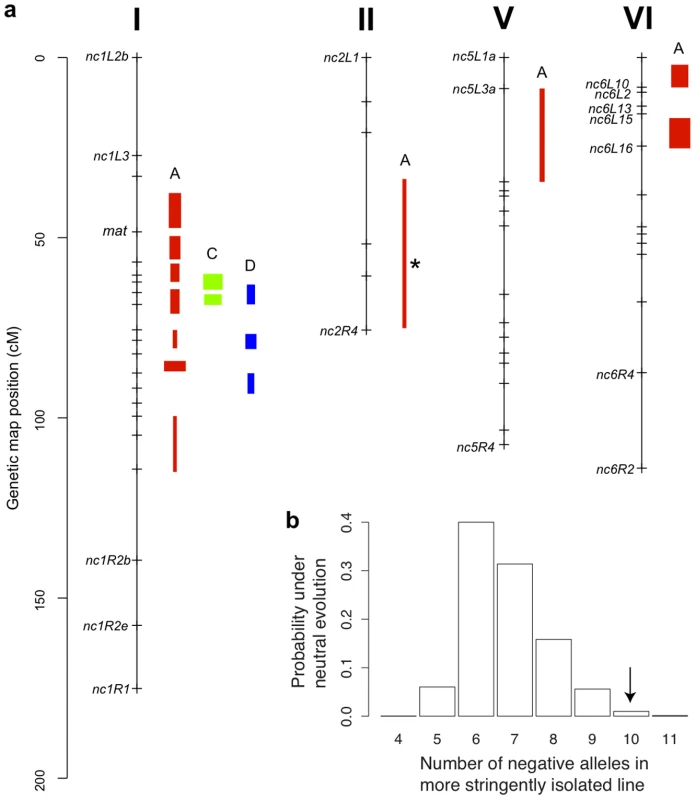
a. Chromosomes with QTLs are shown. Genome-anchored markers are labeled. Height of QTL rectangle indicates 1-LOD confidence interval; width is proportional to percent variance explained (range, 1.9%–11.0%). A = sympatric maternal; C = allopatric maternal; D = allopatric paternal; * = NcC-allele with positive effect. b. Rejection of neutral evolution for hybrid fruitbody abortion. The probability of observing a genetic architecture as or more biased toward negative alleles than NcC (arrow) is 0.0099. Allele bias was determined in 10,000 replicates of a neutral evolution model, assuming phenotypic disparities at least as great as in parental sympatric maternal fruitbody development, 11 QTLs, and genetic effects magnitudes distributed as in observed QTLs. Fig. 5. Composite interval mapping of hybrid fruitbody development in crosses between N. crassa and N. intermedia. 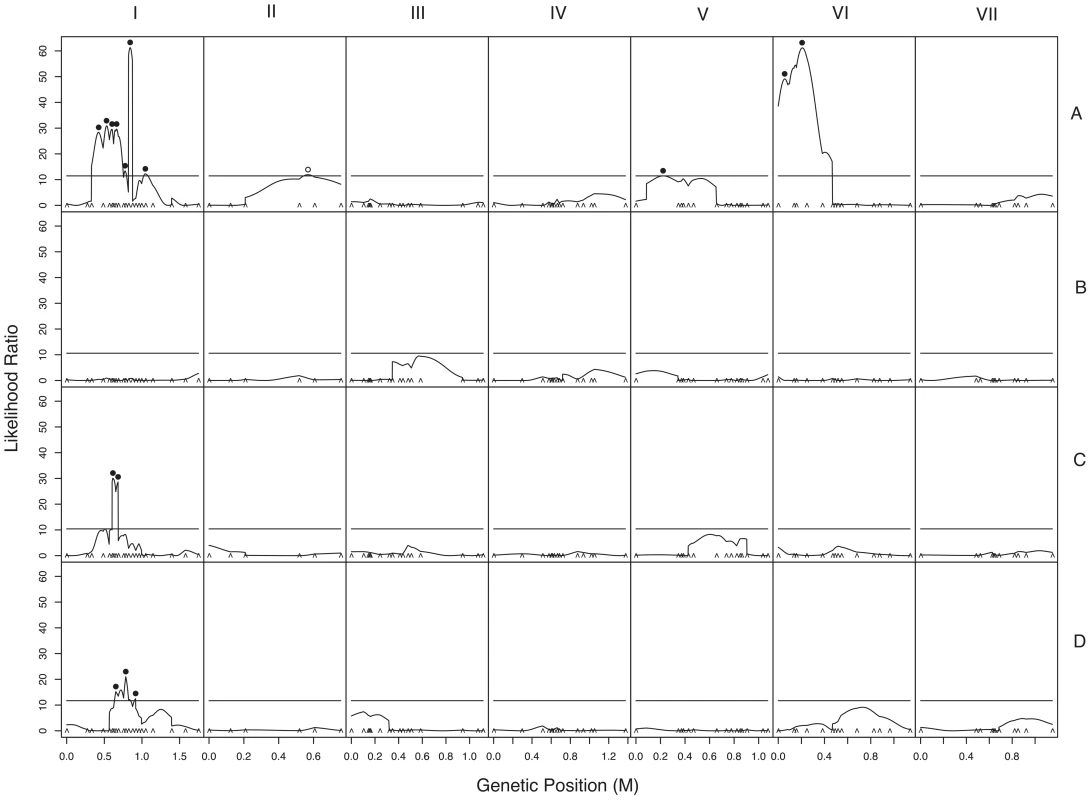
The y-axes show the likelihood ratio statistic determined by composite interval mapping under the hypothesis that a QTL exists versus the null hypothesis that no QTL exists. The critical likelihood ratio threshold (horizontal line) reflects a Type I error of 0.05. The x-axis represents the seven linkage groups of the N. crassa genetic map (cM) generated in this study. Solid black circles indicate the positions of significant QTLs whose NcC alleles have negative effects on hybrid fruitbody development and open circles indicate QTLs whose NcC alleles have a positive effect on fruitbody development. Results for four traits are pictured: row 1, trait A—maternal influence on fruitbody development in N. crassa fertilized by sympatric N. intermedia from Tamil Nadu; row 2, trait B—paternal influence on fruitbody development by sympatric N. intermedia from Tamil Nadu fertilized by N. crassa from the mapping population; row 3, trait C—maternal influence on fruitbody development by N. crassa fertilized by allopatric N. intermedia from Africa; row 4, trait D—paternal influence on fruitbody development on allopatric N. intermedia from Africa fertilized by N. crassa from the mapping population. Tab. 9. QTLs for hybrid fruitbody development in crosses between N. crassa and N. intermedia. 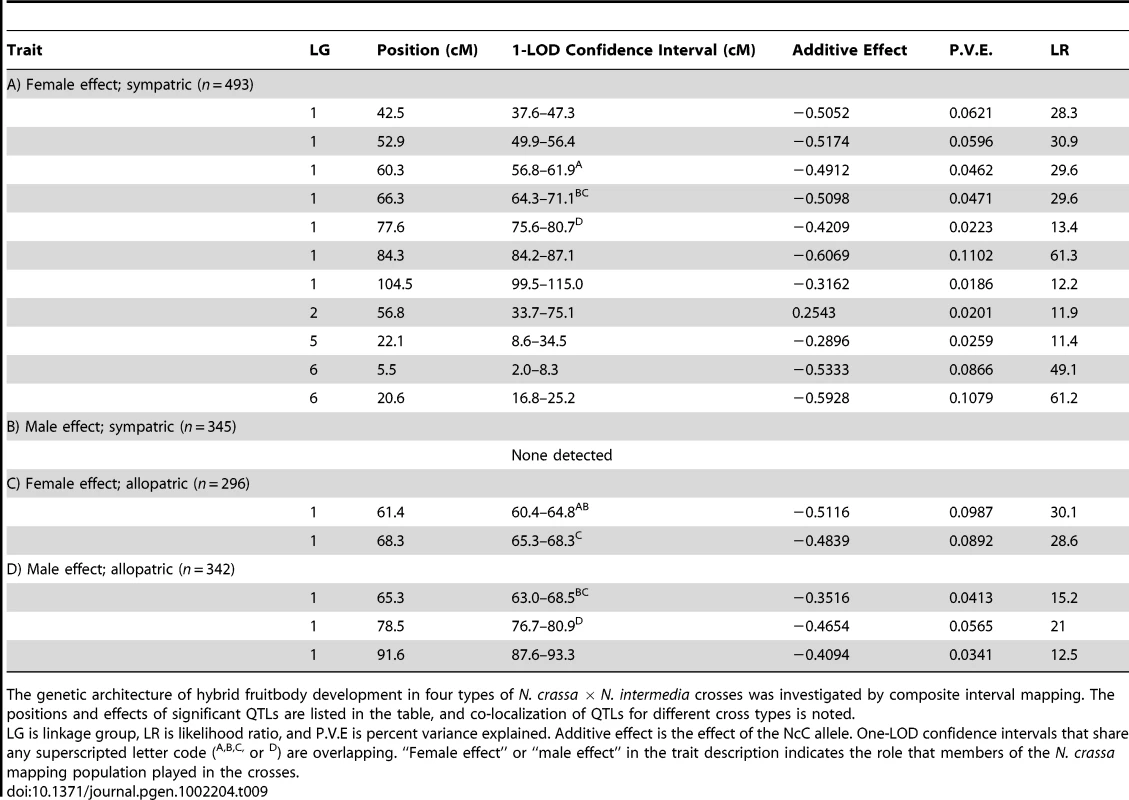
The genetic architecture of hybrid fruitbody development in four types of N. crassa × N. intermedia crosses was investigated by composite interval mapping. The positions and effects of significant QTLs are listed in the table, and co-localization of QTLs for different cross types is noted. For 10 of the 11 QTLs, the allele from the sympatric NcC-India parent has a negative effect on sympatric fruitbody development. Only the weak QTL on LG II has the opposite effect. The prevalence of negative alleles in the NcC-India background is consistent with evolution of abortion via directional natural selection. This inference can be statistically tested by the QTL sign test, which tests the null hypothesis that the observed genetic architecture was generated during neutral trait evolution, i.e., without selective advantage for negative alleles [32].
The QTL sign test assumes that all QTL effects are additive. We note that the accepted model of intrinsic, postzygotic isolation barriers involves negative among species-specific alleles in hybrids. However, our experiments were not designed to, nor can they, interrogate the genetics of hybrid dysfunction, but rather the genetics of evolutionary response to maladaptive hybridization. The genetic architecture of reinforcement may or may not involve epistatic effects. However, in contrast to the case of hybrid dysfunction, epistasis would involve within-genome, interaction effects among loci contributing to the reinforced barrier. To determine whether or not epistasis plays a role in the genetics of reinforced sympatric barriers in N. crassa, and to determine whether or not the genetic data conform to the assumptions of the QTL sign test, we performed a two-dimensional genome scan for interacting QTLs.
No significant interaction effect was detected. Moreover, the genome-wide maximum LOD score for any interaction effect was determined to be 16.7, well below the critical LOD score of 37.4 (for a Type I error of 0.05), which was estimated from 1000 permutations of the data. Because the two-way scan for genetic interactions among loci failed to find any significant or marginally significant interaction effects, the data are consistent with an additive genetic model and conform to the assumption of additivity required for the QTL sign test.
Given the observed number of positive and negative QTLs and the distribution of their effect magnitudes (gamma b = 0.034, c = 13.5), and conditioned on the parental difference in fruitbody development after sympatric fertilization (F.D.S = 2), the null hypothesis of neutral trait evolution for abortion in NcC-India is rejected (QTL sign test, P = 0.0099) (Figure 4b). This result implies that fruitbody abortion in sympatric NcC-India–maternal×N. intermedia-paternal crosses (trait A) evolved under positive natural selection via a reinforcement mechanism.
One of the major QTLs on LG VI is flanked by two microsatellite loci, nc6L15 and nc6L16, and can therefore be physically located to a 135,874 bp region of the N. crassa genome containing 24 ORFs (Table S1) [36].
Genetics of fruitbody development in the absence of reinforced barriers
We also investigated the genetics of fruitbody development in crosses not showing reinforced isolation (Traits B, C, and D, see Table 4). Note that NcC-Indian strains show enhanced isolation from Indian N. intermedia only when the NcC-Indian strain performs the maternal role [16]. We did not detect any QTLs for paternal influence on the development of sympatric fruitbodies (trait B), but in crosses to allopatric N. intermedia strains we detected two QTLs affecting maternal influence and three QTLs affecting paternal influence on fruitbody development (traits C and D, respectively; Figure 4a). All five of these loci are located on LG I. Four of the five allopatric QTLs co-localize with three of the sympatric QTLs on LG I, which could either indicate the presence of genes with pleiotropic effects or linked genes with trait-specific effects.
Discussion
Reinforcement alleles and segregation distortion on Linkage Group I
Linkage group I represents less than 24% of the genome, and it is striking that 75% of our QTLs map here. Interestingly, 73% of loci showing non-Mendelian segregation also map to linkage group I, so that every QTL on this linkage group is flanked by at least one marker showing segregation distortion. In all cases, the NcC alleles of the linkage group I QTLs have a negative effect on sympatric hybrid fruitbody development, and the NcC alleles of the linkage group I markers are underrepresented in the NcA×NcC N. crassa mapping population.
It is not known why one-fifth of genetic markers are distorted in favor of the NcA allele. It is possible that, because laboratory strains of N. crassa have historically been derived from the NcA clade, our crossing and progeny-isolation methods, which were developed for NcA-clade N. crassa, have inadvertently created a selective environment favoring NcA alleles at loci linked to distorted markers. It is also possible that distorter loci present in the NcA background are normally repressed through the action of NcA modifier loci, but become unrepressed and active in some recombinant NcA×NcC genotypes. Although segregation distortion can be caused by nuclear-cytoplasm incompatibilities, it is unlikely to be the cause in this case. The Neurospora mapping population comprises a mixture of individuals with NcA-Louisiana cytoplasm and NcC-India cytoplasm. Moreover, even in individuals with NcC-India cytoplasm, linkage group I markers are distorted in favor of the NcA allele, with an overall NcA allele frequency of 0.61 for markers on this linkage group.
Another hypothesis is that reinforcement alleles themselves can pleiotropically cause ascospore inviability in conspecific, inter-clade crosses. Laboratory crosses between members of the NcA and NcC clades are partially intersterile, usually resulting in <50% ascospore viability [15]. In Neurospora, all products of meiosis contribute to the ascospore cohort, so segregation distortion most likely results from inviability of hybrid ascospores carrying the disfavored NcC allele(s).
Pleiotropy for reinforcement and reproductive isolation between allopatric conspecifics has previously been observed in animals [37], [38]. Reduced conspecific fertility can present a challenge to the evolution of reinforced barriers, since the fitness advantage of avoiding hybridization must outweigh the cost of lower conspecific fertility. However, restricted migration between conspecific populations should reduce the incidence of interpopulation mating and reduce the fitness costs associated with pleiotropic effects on conspecific fertility. The NcC and NcA clades are geographically separated, so limited interclade migration would reduce the fitness cost to NcC of lower fertility with NcA and facilitate the spread of reinforcement alleles in the NcC clade. If the pleiotropy hypothesis is correct, the evolution of reinforcement QTL on linkage group I could be a partial explanation for the evolution of incomplete reproductive isolation between the NcC and NcA clades.
Notably, QTLs on other linkage groups (II, V and VI) are flanked by markers showing Mendelian segregation, so that for these QTLs there is no suggestion of pleiotropic negative effects on within-species, inter-clade reproduction. Moreover, the two reinforcement QTLs on linkage group VI lie in the vicinity of three markers (tnc088, nc6L13, nc6L2), which participate in non-random associations with loci on other linkage groups, such that recombinant, non-parental haplotypes are overrepresented in the mapping population. Therefore the patterns of marker inheritance near QTLs on these other linkage groups do not suggest any connection between reinforcement QTLs and isolation of conspecific allopatric N. crassa populations.
We note that linkage group I contains the mating-type locus of Neurospora, and that some studies have found that reproductive isolation loci are more prevalent on sex-determining chromosomes than on autosomes [39], [40]. It is true that in a closely related species, N. tetrasperma, recombination is suppressed over a large region of Linkage Group I in a process considered analogous to an early stage of sex-chromosome evolution [41]. However, no recombination block exists on linkage group I of N. crassa. Additionally, Neurospora species are hermaphroditic, so the mating-type locus determines mating compatibility, rather than sexual role. We therefore consider it unlikely that the same forces that cause reproductive isolation loci to preferentially accumulate on sex chromosomes can account for the prevalence of the observed QTLs on linkage group I.
A previously identified reproductive isolation QTL on linkage group I
Earlier genetic studies of reproductive isolation in Neurospora identified a QTL on linkage group I as the N. crassa member of a Dobzhansky-Muller incompatibility locus-pair responsible for a severe defect in hybrid perithecial development between allopatric N. crassa and N. intermedia when N. crassa acts as the male partner [42], [43]. These incompatibility loci were first identified in populations of N. crassa×N. intermedia hybrids evolved under divergent environmental conditions in a test of the hypothesis that ecological adaptation can incidentally drive reproductive isolation [42]. Subsequent mapping determined that the incompatibility was caused by interactions between an N. crassa locus (dma on linkage group I) and an N. intermedia locus (dfe on linkage group V) [43]. Considering that both the geographic relationship of the species and gender role of N. crassa differ between this study and ours, it is very interesting that the N. crassa dma locus maps to a region of linkage group I that potentially coincides with the locations of QTLs identified in our study. Direct comparison between mapping results is prevented by the absence of sequence anchored, microsatellite markers in this region of our map.
Conclusions
Sexual microbes are likely to have simple premating recognition mechanisms, but will nevertheless experience selective pressure to avoid maladaptive hybridization. When evolution of premating barriers is constrained, microbial reinforcement may be more likely to involve non-premating-recognition mechanisms, including differentiated substrate or host fidelities [10] or evolution of divergent mating kinetics [44]. Here we have shown that selective abortion of hybrid fruitbodies by N. crassa fertilized by sympatric N. intermedia had the potential to evolve by natural selection by demonstrating that maternal colonies that abort hybrid fruitbodies are subsequently able to mate normally with conspecifics and can have higher reproductive fitness. We then show that the genetic architecture of hybrid fruitbody abortion is consistent with evolution via directional natural selection. Plants and animals are known to sometimes selectively abort otherwise viable embryos, thereby restricting parental investment to offspring with higher potential fitness [45]. Our data show that microbes like Neurospora, which provide costly parental care and are capable of multiple matings, are capable of undergoing reinforcement selection for selective abortion of hybrid offspring. Further studies on the evolution and genetics of reproductive isolation in microbial eukaryotes will be needed to challenge this hypothesis.
Materials and Methods
Neurospora strains and culture conditions
The biology of Neurospora, the evolutionary relationships among species and clades, and the biogeography of reproductive isolation between N. crassa and N. intermedia have been described previously [15], [16]. Culturing, crossing, and isolation of ascospore progeny were performed as previously described [15], [17]. Table S1 lists the wild-collected Neurospora strains used in this study. The QTL mapping population created for this study has been deposited with the Fungal Genetics Stock Center, Kansas City, Missouri.
Sequential fertilization
Sequential fertilization was performed according to the methods of Howe and Prakash [27], except that at the first mating time point (5 days after inoculation of the NcC-India maternal strain), the conidial suspension of one fertilizing strain (either an NcC-India strain as conspecific positive control; an allopatric N. intermedia (African (n = 2) or Caribbean (n = 2)); sympatric N. intermedia (Indian (n = 2)); or water negative control) was applied to 50% of the plate, while at the second time point (10 days after maternal inoculation), the fertilizing suspension of NcC-India was applied to two 1 cm2 spots located 1.5 cm–2 cm from the edge of the first fertilization. Three replicates were performed for a total of 24 plates. Fertility was scored 20 days after maternal inoculation using a 0–6 reproductive success scale (RSS) [15]. The effects of cross type and geographic origin and strain identity of the first–time-point fertilizing males on reproductive success of the second–time-point crosses were analyzed using a semi-parametric, proportional hazards model, with nested effects, as implemented by JMP 5.0.1a.
Genotyping
We obtained genomic DNA for each member of the QTL mapping population following the protocol of Dettman et al. [15]. AFLP and microsatellite primer sequences are shown in Table 5, Table 6, and Table 7. The mat-a1 and mat-A1 loci were amplified by multiplex PCR with the following primers: Ba1-5, AAGAAGAAGGTCAACGGCTTCATG; Ba1-3, CCAGAGCCATGTTCTAGGAATCATT; Sa1-5, CGTCGATGGCAATCTTTTCTGGAA; and Sa1-3, ATTGGCATCGTAGTTGAGAAGCTT [46]. The mat-a1 and mat-A1 fragments were distinguished by agarose gel electrophoresis. Genomic DNA was prepared for amplification of AFLP loci with the Invitrogen AFLP Core Reagent Kit. Selective “E” primers were 5′-modified with either 6-FAM or HEX fluorescent dye, and products of selective amplification were electrophoretically separated on an ABI 3100 genetic analyzer, and data were collected and analyzed with the ABI software GeneScan and Genotyper (Applied Biosystems, Inc., Carlsbad, CA).
Microsatellite loci in targeted genomic regions (e.g., chromosome ends and QTL regions) were selected from a published list of SSR in N. crassa [47], and primers were designed with Primer3 on the web [48]. Forward primers were 5′-fluorescently labeled with NED, 6-FAM, or HEX dyes, and size data were collected as for AFLP markers, above.
Linkage analysis
Linkage analysis was performed with MAPMAKER/EXP 3.0 [49]. Loci were sorted into sets of linked markers iteratively at a linkage threshold of 3.0 LOD and 50 cM (Kosambi) and then 6.0 LOD and 30 cM using the “group” command. For each linkage group, the “order” command was used to identify the best marker order with a window of 7 markers and a log-likelihood exclusion threshold of 2.0, followed by attempted placement of excluded markers at log-likelihood 1.0. Marker order was confirmed using the “ripple” command to permute five neighboring loci at a time and flag any alternative orders within a log-likelihood of 2.0 of the best order. Markers that could not be placed confidently according to these criteria were discarded. Linkage groups were assigned to the seven chromosomes of N. crassa based on inclusion of multiple microsatellite markers targeted to that chromosome.
Mendelian segregation of markers was checked in R/qtl [50] with the “geno.table” command. Linkage disequilibrium in pairs of physically unlinked markers was tested in Genepop 3.4 [51], using option 2, which uses a Fisher exact test implementing a Markov chain to estimate an unbiased P-value. Experiment wide significance threshold (Type I error α = 0.05) was determined by Bonferroni correction for the 21 non-identical linkage-group pairs.
QTL analysis
We investigated the genetics of hybrid fruitbody development in four kinds of N. crassa×N. intermedia matings (Table 4). Crosses were performed on synthetic cross media in 16×100 mm tubes. At 10 days post-fertilization, fruitbody development scores (FDS) were recorded following a four-category scale: 0, no fruitbody development; 1, early abortion (small fruitbodies without apical pores (ostioles)); 2, late abortion (larger fruitbodies with ostioles, but lacking “beaks”); and 3, fully developed (large flask-shaped fruitbodies with ostioles and “beaks”). Some crosses resulted in a mixture of two consecutive fruitbody development stages and were recorded as half steps in the scale (e.g., crosses with early - and late-aborted fruitbodies were recorded as 1.5).
Quantitative trait loci (QTLs) were identified by composite interval mapping (CIM) using Windows QTL Cartographer, v2.5 [52]. CIM was performed under model 6 with 5 control markers and a window size of 20 cM using a 1 cM walk speed. At each step the likelihood ratio statistic (LR) testing the hypothesis that a QTL exists versus the null hypothesis that no QTL exists was determined. For each trait, a critical LR threshold reflecting a Type I error of 0.05 was estimated by permuting the data 1000 times. Significant QTLs were CIM maxima whose LR exceeded the critical threshold and whose 95% confidence intervals were discontinuous with those of other CIM maxima. Ninety-five percent support intervals were estimated as the area bounded by 1-LOD drops in the LR where LOD = log10(LR/2 ln 10).
The null hypothesis of neutral trait evolution for sympatric hybrid fruitbody abortion (the reinforcement trait) was tested by subjecting the genetic effects data to a QTL sign test [32], as implemented by the QTLsigntest software provided by H. A. Orr. Because the QTL sign test assumes an additive genetic model, we first scanned for epistatic loci using “scantwo” of R/qtl using the expectation-maximization, interval mapping algorithm and multipoint genotype probabilities calculated using the “calc.genoprob” command with a step size of 2.5 and an error probability of 0.01. For each chromosome position the likelihood ratio statistic comparing the full epistatic model to the two-locus additive model was determined For each trait, a critical likelihood ratio statistic threshold reflecting a Type I error of 0.05 was estimated by permuting the data set 1000 times.
QTLsigntest determines how likely the proportion of loci with positive vs. negative additive effects is under a neutral model of complex trait evolution, when conditioned on the magnitude of the trait difference in the parent strains, the number of detected QTLs, the threshold of detection, and distribution of the absolute value of additive effects, which are all empirically determined. QTLsigntest was parameterized as follows: Parental RSS difference = 2; number of QTLs = 11; detection threshold = 0.25; effects distribution gamma (shape = 13.5, scale = 0.034).
Supporting Information
Zdroje
1. DarwinC 1876 On the Origin of Species by Means of Natural Selection London John Murray
2. WallaceAR 1889 Darwinism: an Exposition of the Theory of Natural Selection, with Some of its Applications London MacMillan & Co
3. MarchantJ 1916 Alfred Russel Wallace: Letters and Reminiscences London Cassell and Co
4. FisherRA 1930 The genetical theory of natural selection Oxford Clarendon Press
5. DobzhanskyT 1937 Genetics and the origin of species New York Columbia University Press
6. CoyneJAOrrHA 2004 Speciation Sunderland, MA Sinauer Associates, Inc
7. CoyneJA 1974 The evolutionary origin of hybrid inviability. Evolution 28 505 506
8. JohnsonNAWadeMJ 1995 Conditions for soft selection favoring the evolution of hybrid inviability. Journal of Theoretical Biology 176 493 499
9. WallaceB 1988 Selection for the inviability of sterile hybrids. J Hered 79 204 210
10. Le GacMGiraudT 2008 Existence of a pattern of reproductive character displacement in Homobasidiomycota but not in Ascomycota. Journal of Evolutionary Biology 21 761 772
11. MacleanCJGreigD 2008 Prezygotic reproductive isolation between Saccharomyces cerevisiae and Saccharomyces paradoxus. Bmc Evolutionary Biology 8
12. GrantV 1966 The selective origin of incompatibility barriers in the plant genus Gilia. American Naturalist 100 99 118
13. StephensSG 1946 The Genetics of Corky .1. The New World Alleles and Their Possible Role as an Interspecific Isolating Mechanism. Journal of Genetics 47 150
14. MatuteDR 2010 Reinforcement of gametic isolation in drosophila. PLoS Biol 8 e1000341 doi:10.1371/journal.pbio.1000341
15. DettmanJRJacobsonDJTurnerEPringleATaylorJW 2003 Reproductive isolation and phylogenetic divergence in Neurospora: Comparing methods of species recognition in a model eukaryote. Evolution 57 2721 2741
16. TurnerEJacobsonDJTaylorJW 2010 Biogeography of postmating reproductive isolation barriers is consistent with reinforcement selection in Neurospora, a model microbial eukaryote. Journal of Evolutionary Biology 23 1642 1656
17. PerkinsDDTurnerBCBarryEG 1976 Strains of Neurospora collected from nature. Evolution 30 281 313
18. TurnerBCPerkinsDDFairfieldA 2001 Neurospora from natural populations: A global study. Fungal Genetics and Biology 32 67 92
19. SpiethPT 1975 Population genetics of allozyme variation in Neurospora intermedia. Genetics 80 785 805
20. PerkinsDDTurnerBC 1988 Neurospora from natural populations: toward the population biology of a haploid eukaryote. Experimental Mycology 12 91 131
21. DettmanJRJacobsonDJTaylorJW 2003 A multilocus genealogical approach to phylogenetic species recognition in the model eukaryote Neurospora. Evolution 57 2703 2720
22. DettmanJRTaylorJW 2004 Mutation and evolution of microsatellite loci in neurospora. Genetics 168 1231 1248
23. StrandbergRNygrenKMenkisAJamesTYWikL 2010 Conflict between reproductive gene trees and species phylogeny among heterothallic and pseudohomothallic members of the filamentous ascomycete genus Neurospora. Fungal Genetics and Biology 46 869 878
24. 2010 Fungal genomics program. Joint Genome Institute
25. PoggelerS 2000 Two pheromone precursor genes are transcriptionally expressed in the homothallic ascomycete Sordaria macrospora. Current Genetics V37 403 411
26. KarlssonMNygrenKJohannessonH 2008 The evolution of the pheromonal signal system and its potential role for reproductive isolation in heterothallic Neurospora. Molecular Biology and Evolution 25 168 178
27. HoweHBPrakashV 1969 A regulatory system controlling inhibition in the sexual cycle of Neurospora. Can J Genet Cytol 11 689 705
28. CoxDR 1972 Regression models and life-tables. Journal of the Royal Statistical Society Series B (Methodological) 34 187 220
29. Ortiz-BarrientosDCountermanBANoorMAF 2004 The genetics of speciation by reinforcement. PLoS Biol 2 e416 doi:10.1371/journal.pbio.0020416
30. Ortiz-BarrientosDNoorMA 2005 Evidence for a one-allele assortative mating locus. Science 310 1467
31. SaetherSASaetreGPBorgeTWileyCSvedinN 2007 Sex chromosome-linked species recognition and evolution of reproductive isolation in flycatchers. Science 318 95 97
32. OrrHA 1998 Testing natural selection vs. genetic drift in phenotypic evolution using quantitative trait locus data. Genetics 149 2099 2104
33. AndersonECSlatkinM 2003 Orr's quantitative trait loci sign test under conditions of trait ascertainment. Genetics 165 445 446
34. BatesonW 1909 Heredity and variation in modern lights. SewardAC Darwin and Modern Science Cambridge Cambridge University Press 85 101
35. EllisonCEHallCKowbelDWelchJBremRB 2011 Population genomics and local adaptation in wild isolates of a model microbial eukaryote. Proc Natl Acad Sci U S A In press
36. 2010 Neurospora crassa database. Broad Institute
37. NosilPCrespiBJSandovalCP 2003 Reproductive isolation driven by the combined effects of ecological adaptation and reinforcement. Proceedings of the Royal Society Biological Sciences Series B 270 1911 1918
38. HoskinCJHiggieM 2010 Speciation via species interactions: the divergence of mating traits within species. Ecology Letters 13 409 420
39. TaoYChenSHartlDLLaurieCC 2003 Genetic dissection of hybrid incompatibilities between Drosophila simulans and D. mauritiana. I. Differential accumulation of hybrid male sterility effects on the X and autosomes. Genetics 164 1383 1397
40. TrueJRWeirBSLaurieCC 1996 A genome-wide survey of hybrid incompatibility factors by the introgression of marked segments of Drosophila mauritiana chromosomes into Drosophila simulans. Genetics 142 819 837
41. MenkisAJacobsonDJGustafssonTJohannessonH 2008 The mating-type chromosome in the filamentous Ascomycete Neurospora tetrasperma represents a model for early evolution of sex chromosomes. PLoS Genet 4 e1000030 doi:10.1371/journal.pgen.1000030
42. DettmanJRAndersonJBKohnLM 2008 Divergent adaptatioin promotes reproductive isolation among experimental populations of the filamentous fungus Neurospora. BMC Evol Biol 8 35
43. DettmanJRAndersonJBKohnLM 2010 Genome-wide investigation of reproductive isolation in experimental lineages and natural species of Neurospora: Identifying candidate regions by microarray-based genotyping and mapping. Evolution 64 694 709
44. LeuJ-YMurrayAW 2006 Experimental evolution of mating discrimination in budding yeast. Current Biology 16 280 286
45. KorbeckaGKlinkhamerPGLKV 2002 Selective embryo abortion hypothesis revisited—a molecular approach. Plant Biology (Stuttgart) 4 298 310
46. PoggelerSKuckU 2000 Comparative analysis of the mating-type loci from Neurospora crassa and Sordaria macrospora: identification of novel transcribed ORFs. Molecular and General Genetics V263 292 301
47. KaraogluHLeeCMYMeyerW 2005 Survey of simple sequence repeats in completed fungal genomes. Molecular Biology and Evolution 22 639 649
48. RozenSSkaletskyH 2000 Primer3 on the WWW for general users and biologist programmers. Methods in Molecular Biology 132 365 386
49. LanderESGreenPAbrahamsonJBarlowADalyMJ 1987 Mapmaker an interactive computer package for constructing primary genetic linkage maps of experimental and natural populations. Genomics 1 174 181
50. BromanKWWuHSenSChurchillGA 2003 R/qtl: QTL mapping in experimental crosses. Bioinformatics 19 889 890
51. RaymondMRoussetF 1995 Genepop (Version-1.2) - Population-genetics software for exact tests and ecumenicism. Journal of Heredity 86 248 249
52. WangSBastenCJZengZ-B 2010 Windows QTL Cartographer 2.5. Department of Statistics. North Carolina State University, Raleigh, NC
Štítky
Genetika Reprodukčná medicína
Článek The T-Box Factor MLS-1 Requires Groucho Co-Repressor Interaction for Uterine Muscle SpecificationČlánek B Chromosomes Have a Functional Effect on Female Sex Determination in Lake Victoria Cichlid FishesČlánek Distinct Cdk1 Requirements during Single-Strand Annealing, Noncrossover, and Crossover RecombinationČlánek Specification of Corpora Cardiaca Neuroendocrine Cells from Mesoderm Is Regulated by Notch SignalingČlánek Ongoing Phenotypic and Genomic Changes in Experimental Coevolution of RNA Bacteriophage Qβ and
Článok vyšiel v časopisePLOS Genetics
Najčítanejšie tento týždeň
2011 Číslo 8- Gynekologové a odborníci na reprodukční medicínu se sejdou na prvním virtuálním summitu
- Je „freeze-all“ pro všechny? Odborníci na fertilitu diskutovali na virtuálním summitu
-
Všetky články tohto čísla
- Polo, Greatwall, and Protein Phosphatase PP2A Jostle for Pole Position
- Genome-Wide Association Analysis of Incident Coronary Heart Disease (CHD) in African Americans: A Short Report
- The T-Box Factor MLS-1 Requires Groucho Co-Repressor Interaction for Uterine Muscle Specification
- B Chromosomes Have a Functional Effect on Female Sex Determination in Lake Victoria Cichlid Fishes
- Analysis of DNA Methylation in a Three-Generation Family Reveals Widespread Genetic Influence on Epigenetic Regulation
- PP2A-Twins Is Antagonized by Greatwall and Collaborates with Polo for Cell Cycle Progression and Centrosome Attachment to Nuclei in Drosophila Embryos
- Discovery of Sexual Dimorphisms in Metabolic and Genetic Biomarkers
- Pervasive Sharing of Genetic Effects in Autoimmune Disease
- DNA Methylation and Histone Modifications Regulate Shoot Regeneration in by Modulating Expression and Auxin Signaling
- Mutations in and Reveal That Cartilage Matrix Controls Timing of Endochondral Ossification by Inhibiting Chondrocyte Maturation
- Variance of Gene Expression Identifies Altered Network Constraints in Neurological Disease
- Frequent Beneficial Mutations during Single-Colony Serial Transfer of
- Increased Gene Dosage Affects Genomic Stability Potentially Contributing to 17p13.3 Duplication Syndrome
- Distinct Cdk1 Requirements during Single-Strand Annealing, Noncrossover, and Crossover Recombination
- Hunger Artists: Yeast Adapted to Carbon Limitation Show Trade-Offs under Carbon Sufficiency
- Suppression of Scant Identifies Endos as a Substrate of Greatwall Kinase and a Negative Regulator of Protein Phosphatase 2A in Mitosis
- Temporal Dynamics of Host Molecular Responses Differentiate Symptomatic and Asymptomatic Influenza A Infection
- MK2-Dependent p38b Signalling Protects Hindgut Enterocytes against JNK-Induced Apoptosis under Chronic Stress
- Specification of Corpora Cardiaca Neuroendocrine Cells from Mesoderm Is Regulated by Notch Signaling
- Genome-Wide Gene-Environment Study Identifies Glutamate Receptor Gene as a Parkinson's Disease Modifier Gene via Interaction with Coffee
- Identification of Functional Toxin/Immunity Genes Linked to Contact-Dependent Growth Inhibition (CDI) and Rearrangement Hotspot (Rhs) Systems
- Genomic Analysis of the Necrotrophic Fungal Pathogens and
- Celsr3 Is Required for Normal Development of GABA Circuits in the Inner Retina
- Genetic Architecture of Aluminum Tolerance in Rice () Determined through Genome-Wide Association Analysis and QTL Mapping
- Predisposition to Cancer Caused by Genetic and Functional Defects of Mammalian
- Regulation of p53/CEP-1–Dependent Germ Cell Apoptosis by Ras/MAPK Signaling
- and but Not Interact in Genetic Models of Amyotrophic Lateral Sclerosis
- Gamma-Tubulin Is Required for Bipolar Spindle Assembly and for Proper Kinetochore Microtubule Attachments during Prometaphase I in Oocytes
- Ongoing Phenotypic and Genomic Changes in Experimental Coevolution of RNA Bacteriophage Qβ and
- Genetic Architecture of a Reinforced, Postmating, Reproductive Isolation Barrier between Species Indicates Evolution via Natural Selection
- -eQTLs Reveal That Independent Genetic Variants Associated with a Complex Phenotype Converge on Intermediate Genes, with a Major Role for the HLA
- The GATA Factor ELT-1 Works through the Cell Proliferation Regulator BRO-1 and the Fusogen EFF-1 to Maintain the Seam Stem-Like Fate
- and Control Optic Cup Regeneration in a Prototypic Eye
- A Comprehensive Map of Mobile Element Insertion Polymorphisms in Humans
- An EMT–Driven Alternative Splicing Program Occurs in Human Breast Cancer and Modulates Cellular Phenotype
- Evidence for Hitchhiking of Deleterious Mutations within the Human Genome
- A Broad Brush, Global Overview of Bacterial Sexuality
- Global Chromosomal Structural Instability in a Subpopulation of Starving Cells
- A Pre-mRNA–Associating Factor Links Endogenous siRNAs to Chromatin Regulation
- Glutamine Synthetase Is a Genetic Determinant of Cell Type–Specific Glutamine Independence in Breast Epithelia
- The Repertoire of ICE in Prokaryotes Underscores the Unity, Diversity, and Ubiquity of Conjugation
- Genome-Wide Association Analysis of Autoantibody Positivity in Type 1 Diabetes Cases
- Natural Polymorphism in BUL2 Links Cellular Amino Acid Availability with Chronological Aging and Telomere Maintenance in Yeast
- Chromosome Painting Reveals Asynaptic Full Alignment of Homologs and HIM-8–Dependent Remodeling of Chromosome Territories during Meiosis
- Ku Must Load Directly onto the Chromosome End in Order to Mediate Its Telomeric Functions
- PLOS Genetics
- Archív čísel
- Aktuálne číslo
- Informácie o časopise
Najčítanejšie v tomto čísle- An EMT–Driven Alternative Splicing Program Occurs in Human Breast Cancer and Modulates Cellular Phenotype
- Chromosome Painting Reveals Asynaptic Full Alignment of Homologs and HIM-8–Dependent Remodeling of Chromosome Territories during Meiosis
- Discovery of Sexual Dimorphisms in Metabolic and Genetic Biomarkers
- Regulation of p53/CEP-1–Dependent Germ Cell Apoptosis by Ras/MAPK Signaling
Prihlásenie#ADS_BOTTOM_SCRIPTS#Zabudnuté hesloZadajte e-mailovú adresu, s ktorou ste vytvárali účet. Budú Vám na ňu zasielané informácie k nastaveniu nového hesla.
- Časopisy


