-
Články
- Časopisy
- Kurzy
- Témy
- Kongresy
- Videa
- Podcasty
Transcriptional Regulation of Rod Photoreceptor Homeostasis Revealed by NRL Targetome Analysis
A stringent control of homeostasis is critical for functional maintenance and survival of neurons. In the mammalian retina, the basic motif leucine zipper transcription factor NRL determines rod versus cone photoreceptor cell fate and activates the expression of many rod-specific genes. Here, we report an integrated analysis of NRL-centered gene regulatory network by coupling chromatin immunoprecipitation followed by high-throughput sequencing (ChIP–Seq) data from Illumina and ABI platforms with global expression profiling and in vivo knockdown studies. We identified approximately 300 direct NRL target genes. Of these, 22 NRL targets are associated with human retinal dystrophies, whereas 95 mapped to regions of as yet uncloned retinal disease loci. In silico analysis of NRL ChIP–Seq peak sequences revealed an enrichment of distinct sets of transcription factor binding sites. Specifically, we discovered that genes involved in photoreceptor function include binding sites for both NRL and homeodomain protein CRX. Evaluation of 26 ChIP–Seq regions validated their enhancer functions in reporter assays. In vivo knockdown of 16 NRL target genes resulted in death or abnormal morphology of rod photoreceptors, suggesting their importance in maintaining retinal function. We also identified histone demethylase Kdm5b as a novel secondary node in NRL transcriptional hierarchy. Exon array analysis of flow-sorted photoreceptors in which Kdm5b was knocked down by shRNA indicated its role in regulating rod-expressed genes. Our studies identify candidate genes for retinal dystrophies, define cis-regulatory module(s) for photoreceptor-expressed genes and provide a framework for decoding transcriptional regulatory networks that dictate rod homeostasis.
Published in the journal: Transcriptional Regulation of Rod Photoreceptor Homeostasis Revealed by NRL Targetome Analysis. PLoS Genet 8(4): e32767. doi:10.1371/journal.pgen.1002649
Category: Research Article
doi: https://doi.org/10.1371/journal.pgen.1002649Summary
A stringent control of homeostasis is critical for functional maintenance and survival of neurons. In the mammalian retina, the basic motif leucine zipper transcription factor NRL determines rod versus cone photoreceptor cell fate and activates the expression of many rod-specific genes. Here, we report an integrated analysis of NRL-centered gene regulatory network by coupling chromatin immunoprecipitation followed by high-throughput sequencing (ChIP–Seq) data from Illumina and ABI platforms with global expression profiling and in vivo knockdown studies. We identified approximately 300 direct NRL target genes. Of these, 22 NRL targets are associated with human retinal dystrophies, whereas 95 mapped to regions of as yet uncloned retinal disease loci. In silico analysis of NRL ChIP–Seq peak sequences revealed an enrichment of distinct sets of transcription factor binding sites. Specifically, we discovered that genes involved in photoreceptor function include binding sites for both NRL and homeodomain protein CRX. Evaluation of 26 ChIP–Seq regions validated their enhancer functions in reporter assays. In vivo knockdown of 16 NRL target genes resulted in death or abnormal morphology of rod photoreceptors, suggesting their importance in maintaining retinal function. We also identified histone demethylase Kdm5b as a novel secondary node in NRL transcriptional hierarchy. Exon array analysis of flow-sorted photoreceptors in which Kdm5b was knocked down by shRNA indicated its role in regulating rod-expressed genes. Our studies identify candidate genes for retinal dystrophies, define cis-regulatory module(s) for photoreceptor-expressed genes and provide a framework for decoding transcriptional regulatory networks that dictate rod homeostasis.
Introduction
Molecular mechanisms underlying neuronal differentiation and generation of complex sensory and behavioral circuits in the mammalian central nervous system are still poorly elucidated. Gene regulatory networks (GRNs) integrate key control elements that guide the development of distinct cell types [1], [2], [3] and contribute to precise maintenance of diverse cellular functions. As perturbations in homeostatic mechanisms (e.g., during aging and disease) can cause dysfunction or death of neurons [4], [5], a better understanding of GRNs that control neuronal homeostasis would augment the design of therapies for neurodegenerative diseases.
The rod and cone photoreceptors in mammalian retina are highly specialized neurons that transduce visual signals under dim and bright light conditions, respectively [6]. Daily renewal of almost 10% of outer segment membrane discs creates high metabolic demands, making the photoreceptors vulnerable to genetic and environmental insults [7]. Rods constitute over 95% of all photoreceptors in most mammals, including mice and humans; however, cones mediate high acuity and color vision [8]. Notably, functional impairment or loss of rod photoreceptors is an early clinical manifestation in most retinal neurodegenerative diseases that eventually results in cone cell death and blindness [9], [10], [11]. The GRNs that dictate homeostatic responses in mature rod photoreceptors have not been elucidated.
During development, rod and cone photoreceptors are produced from common pools of retinal progenitors under the control of multiple transcription factors and regulatory signaling pathways [11], [12], [13]. Furthermore, the basic motif-leucine zipper protein NRL is the dominant transcription factor that determines rod photoreceptor cell fate. In Nrl−/− mice, all post-mitotic cells originally fated to become rods instead generate a cone-only photoreceptor layer [14], whereas ectopic Nrl expression in photoreceptor precursors produces a rod-only retina [15]. Interestingly, knock-in mice where Nrl is replaced by thyroid hormone receptor β2 (Trb2) have an M-cone dominant retina, but the presence of both NRL and TRb2 yields a normal contingent of rods [16]. A key transcriptional target of NRL is the orphan nuclear receptor NR2E3 that primarily represses cone genes to establish rod identity [17], . The cone-rod homeobox CRX is another essential transcriptional activator of photoreceptor-specific genes as rods and cones in Crx−/− mice do not develop outer segments and eventually die [20], [21], [22]. NRL and CRX continue to be expressed at high levels in mature retina and in rod photoreceptors ([23]; Gotoh, Swaroop et al. unpublished data). Protein interaction and transcriptional activation assays, combined with expression profiling of knockout mice, demonstrate that NRL and CRX are the two major regulators of rod photoreceptor gene expression [24], [25], [26], [27].
We hypothesize that detailed mapping of a rod-specific GRN would lead to the development of better therapeutic interventions in blinding diseases involving photoreceptor degeneration. Here we report the genomewide NRL in vivo occupancy in adult mouse retina by chromatin immunoprecipitation followed by high-throughput sequencing (ChIP–Seq) using Illumina and ABI sequencing platforms. We perform an integrated analysis by coupling the NRL ChIP–Seq data with published photoreceptor-specific transcriptional profiles and CRX ChIP–Seq results. We use in vivo knockdown assays to examine the physiological relevance of NRL target genes and identify secondary regulatory nodes downstream of NRL in rod transcriptional hierarchy. Our studies establish NRL and CRX as the key regulatory nodes for rod-expressed genes, identify NRL targets as candidate genes for retinal diseases, and provide a framework for GRN that controls homeostasis in rod photoreceptors.
Results
Genome-Wide Mapping of NRL Occupancy by ChIP–Seq
We performed chromatin immunoprecipitation experiments using anti-NRL antibody (with normal IgG as a control) to pull down the genomic fragments bound by NRL in vivo in adult mouse retina. The ChIP DNA was subjected to direct high-throughput sequencing using either Illumina 1G genome analyzer or ABI/SOLiD system (ABI). The workflow for the analysis of two datasets is shown in Figure 1A. (see www.nei.nih.gov/intramural/nnrldataresource.asp for raw sequence reads). Illumina and ABI datasets contained a total of 8 million 25-bp reads and 18.0 million 35-bp reads, respectively. Of these, respectively 5.3 million (66.3%) and 6.3 million (35%) reads were uniquely mapped to the mouse genome (NCBI Build 37, UCSC mm9), with overlapping sequence reads forming the NRL ChIP–Seq peaks (Table 1). We used NGS Analyzer (Genomatix) and MACS [28], in parallel, to determine NRL ChIP–Seq peaks with ChIP–Seq counts from negative control (normal IgG) libraries as thresholds. The peaks identified by both algorithms (intersected peaks) were kept for further analyses (Figure 1A, Table 2). Illumina and ABI platforms revealed 2790 and 5625 NRL ChIP–Seq peaks, respectively (Table 2). The number of peaks did not correlate with chromosome size (data not shown), indicating the interaction of NRL with specific genomic regions. The average peak widths were 398 bp (Illumina) and 408 bp (ABI), with average peak heights being 58.0 (Illumina) and 79.9 (ABI) and median peak heights of 30 (Illumina) and 47 (ABI) (Table 2). Illumina and ABI ChIP–Seq peak centers showed a strong correlation (Figure 1B), with almost 90% of Illumina peaks overlapping with ABI peaks (Figure 1B).
Fig. 1. Genome-wide Occupancy of NRL revealed by ChIP–Seq using Illumina and ABI/SOLiD sequencing platforms. 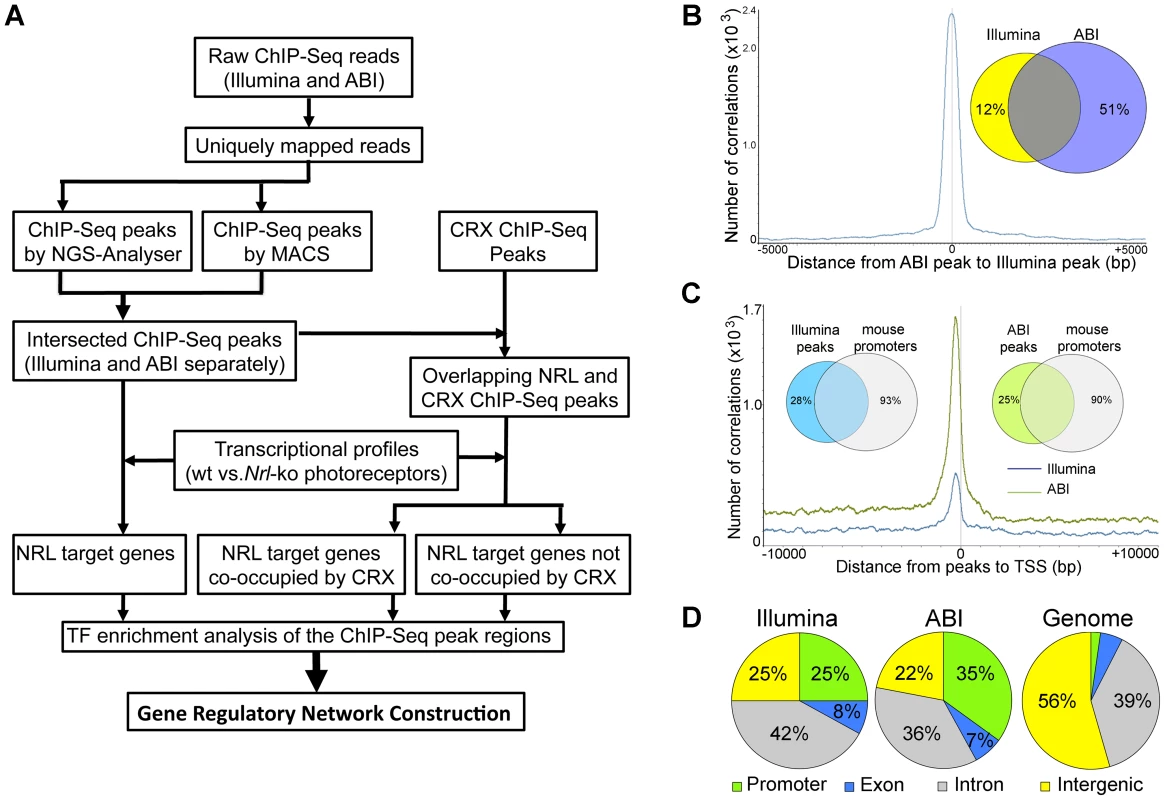
(A) Analysis workflow. Raw sequence reads from Illumina or ABI/SOLiD were mapped to the mouse genome (NCBI build 37) using the Genomatix Mining Station (GMS) and the reads mapped to unique genomic locations (uniquely mapped reads) were used for further analyses. ChIP–Seq peaks were called using NGS Analyzer (Genomatix) or MACS (Zhang et al., 2008), and the common peaks were used for further analyses. The NRL ChIP–Seq peaks were compared to the CRX ChIP–Seq peaks for overlapping using GenomeInspector (Genomatix) software. The ChIP–Seq peaks were assigned to the nearest gene. Transcription profile analyses of flow-sorted photoreceptors of WT and Nrl−/− were performed using ChipInsepector program (Genomatix) and 1.5 fold expression change was used as a criterion for NRL target genes. TF motif enrichment analyses were performed on the NRL ChIP–Seq peak regions that were associated with NRL target genes. Comparison was made between CRX-overlapping and non CRX-overlapping NRL ChIP–Seq peaks. Gene regulatory network was constructed based on TF enrichment analysis. (B) Correlation of ChIP–Seq peaks by Illumina and ABI. The number of correlations (y-axis) was plotted to the distance of ABI ChIP–Seq peaks to Illumina ChIP–Seq peaks (x-axis). The Venn diagram (inset) calculated the percentage of ABI and Illumina peaks within 500 bp of each other: 88% of Illumina peaks are within 500 bp of ABI peaks and 49% of ABI peaks are within 500 bp of Illumina peaks. (C) Correlation of ChIP–Seq peaks to promoters. The number of correlation (y-axis) was plotted to the distance of ABI ChIP–Seq peaks (green graph) or Illumina ChIP–Seq peaks (blue graph) to the transcription start site (TSS) (x-axis). The Venn diagram (inset) calculated the percentage of ABI (75%) or Illumina (72%) peaks within 10,000 bp from the TSS. (D) Genomic distribution of NRL ChIP–Seq peaks relative to the nearest annotated genes. Promoters and exons account for 2.3% and 5.4% of the mouse genome, respectively. Tab. 1. Comparison of ChIP–Seq peaks by Illumina and ABI. 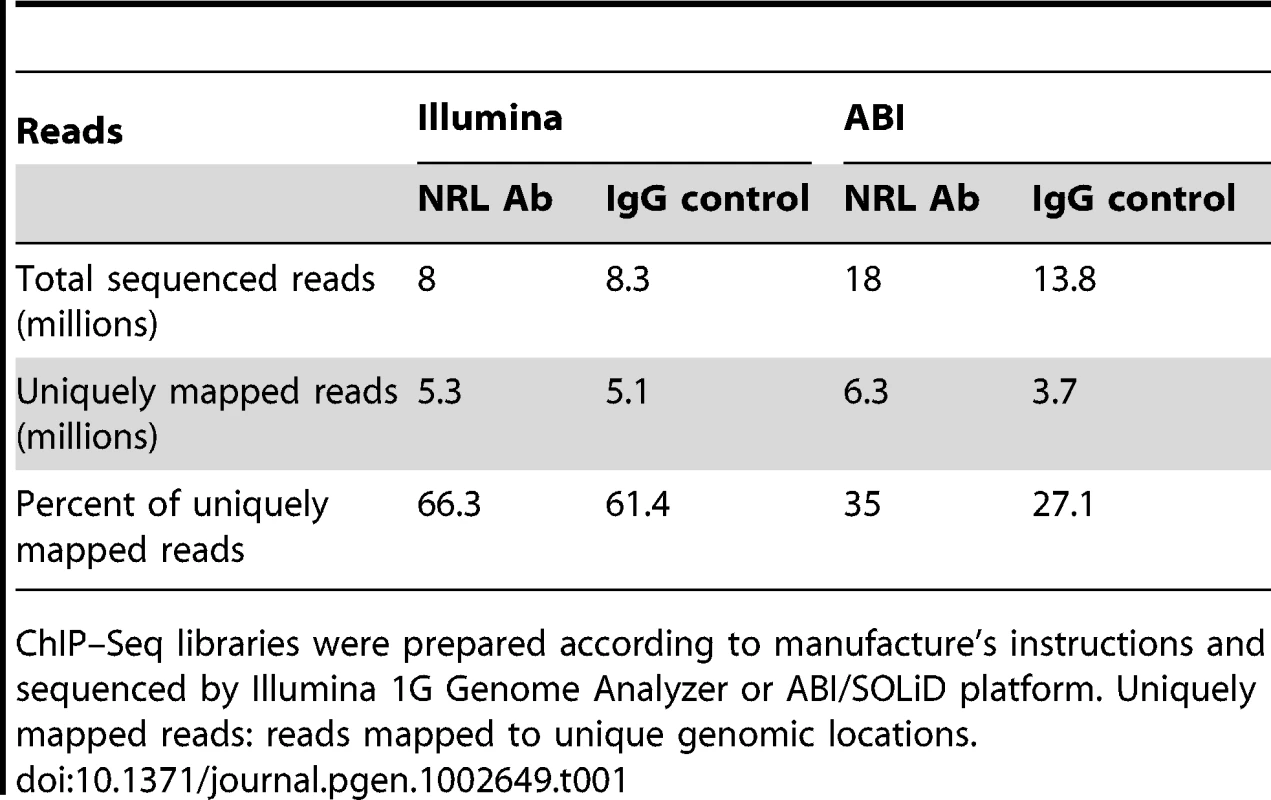
ChIP–Seq libraries were prepared according to manufacture's instructions and sequenced by Illumina 1G Genome Analyzer or ABI/SOLiD platform. Uniquely mapped reads: reads mapped to unique genomic locations. Tab. 2. Comparison of ChIP–Seq peaks by Illumina and ABI. 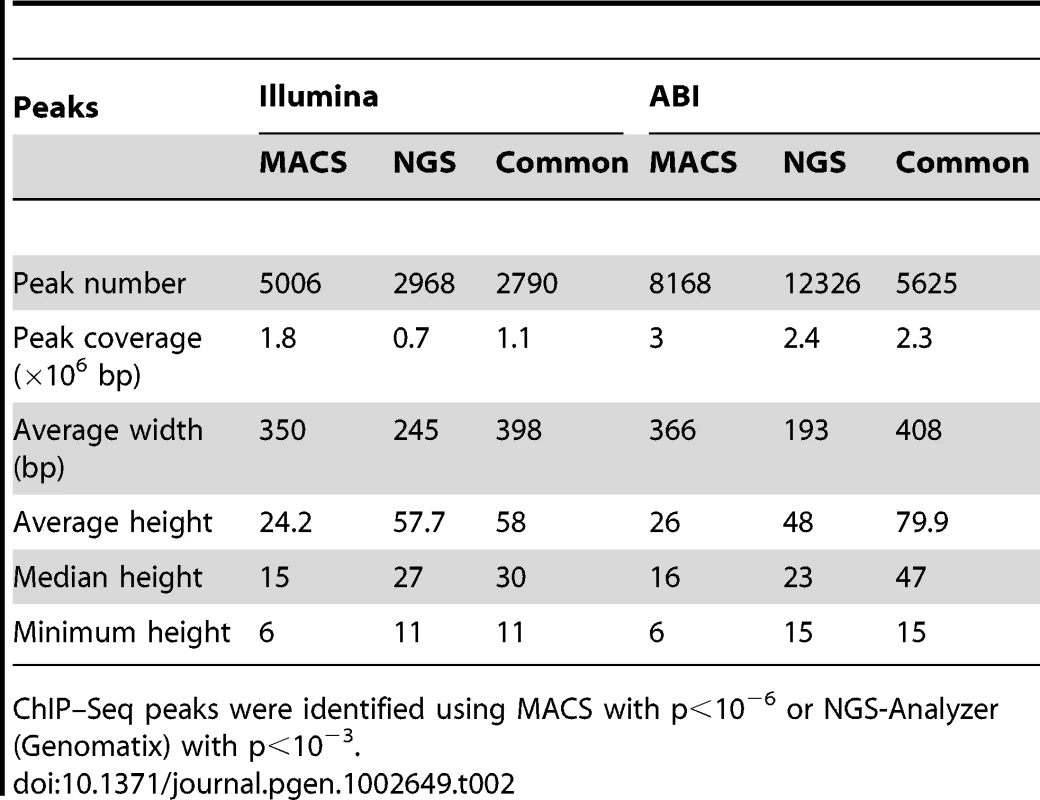
ChIP–Seq peaks were identified using MACS with p<10−6 or NGS-Analyzer (Genomatix) with p<10−3. A large number of NRL ChIP–Seq peaks were mapped within 1 kb of the transcription start sites (Figure 1C, Table S1). Furthermore, over 70% of NRL ChIP–Seq peaks were present within 10 kb of 7–10% of mouse gene promoters (see Venn diagram in Figure 1C). The NRL ChIP–Seq peaks from both Illumina and ABI platforms are highly enriched in promoter regions, given that promoters only account for approximately 2% of the mouse genome (Figure 1D).
Integration of ChIP–Seq with Expression Profiling
In order to identify physiologically relevant NRL target genes, we examined Illumina and ABI ChIP–Seq data in combination with global expression profiles of flow-sorted photoreceptors from wild type (WT) and Nrl−/− mouse retina [25]. Of 2143 genes associated with Illumina ChIP–Seq peaks, 216 exhibited at least 1.5 fold less expression and 80 genes showed higher expression in Nrl−/− photoreceptors (Figure 2A). Of 4085 genes associated with ABI ChIP–Seq data, we identified 291 genes with lower and 131 genes with higher expression in the Nrl−/− photoreceptors (Figure 2A). A combined analysis of Illumina and ABI ChIP–Seq datasets yielded 281 genes showing altered expression in Nrl−/− photoreceptors. A high correlation was detected between NRL ChIP–Seq peaks (from both Illumina and ABI datasets) and promoters of genes that are differentially expressed in rod photoreceptors of WT versus Nrl−/− retina (Figure 2B). For convenience, we will refer genes associated with NRL ChIP–Seq peaks and altered in Nrl−/− retina as direct transcriptional targets of NRL.
Fig. 2. Identification of NRL target genes and co-regulatory transcription factors by ChIP–Seq and transcriptional profiling. 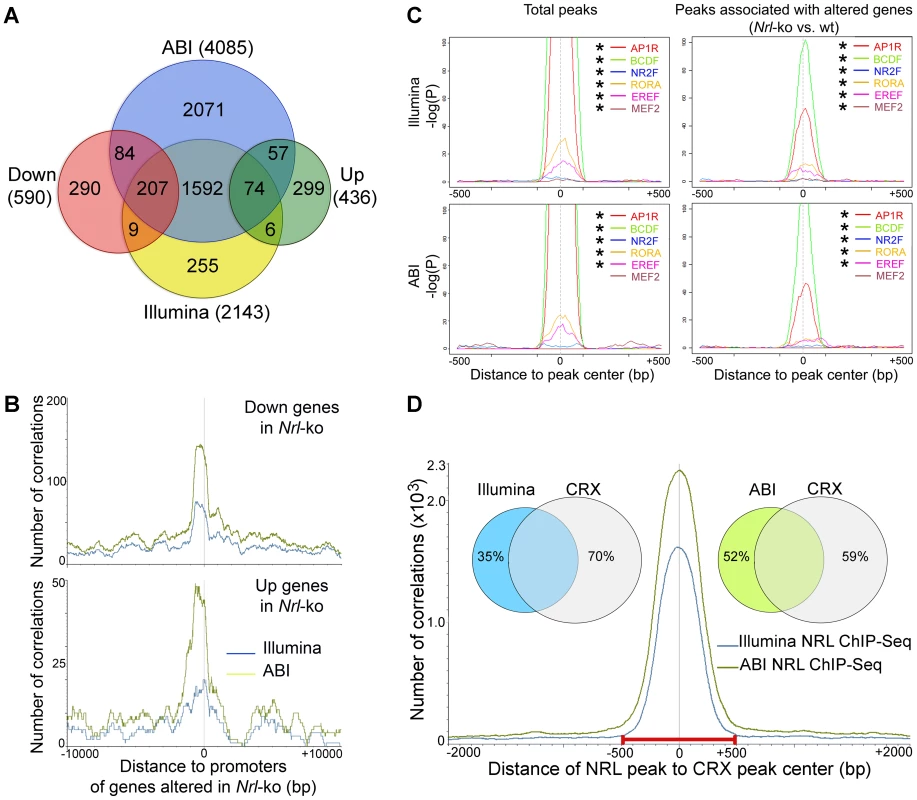
(A) Identification of direct NRL transcriptional target genes by ChIP–Seq and transcription profiling. ABI ChIP–Seq peaks and Illumina ChIP–Seq peaks were assigned to the nearest genes (ABI and Illumina). Transcriptional profiling of flow-sorted photoreceptors of WT or Nrl−/− mice was generated using microarrays. Up: genes up-regulated in Nrl−/− photoreceptors. Down: genes down-regulated in Nrl−/− photoreceptors. (B) Correlation of NRL ChIP–Seq peaks to the promoters of its target genes. The number of correlation (y-axis) was plotted to the distance (x-axis) of ABI ChIP–Seq peaks (green graph) or Illumina ChIP–Seq peaks (blue graph) to the promoters of the genes that were down-regulated (top) or up-regulated (bottom) in the Nrl−/− photoreceptors. (C) TF enrichment and TF binding site (TFBS) positional bias analysis. NRL ChIP–Seq peak regions were analyzed for TF enrichment using Genomatix RegionMiner. The positional bias of TFBS (P) was calculated and plotted as −log(P) (y-axis) to the distance of TFBS to the peak center (x-axis). Positions where TFBS are overrepresented appear as peaks in these plots. * significantly enriched. (D) Correlation of NRL ChIP–Seq peaks with CRX ChIP–Seq peaks. The number of correlation (y-axis) was plotted to the distance of NRL ChIP–Seq peaks to CRX ChIP–Seq peaks (x-axis). The Venn diagram (inset) calculated the percentage of NRL ChIP–Seq peaks (Illumina and ABI) within 500 bp of CRX peaks: 65% of Illumina peaks and 48% of ABI peaks are within 500 bp of CRX peaks. Enrichment of Co-Regulatory Modules within NRL ChIP–Seq Peaks
As transcription factor interactions determine the specificity of gene expression patterns [29], [30], we performed motif enrichment analysis (Genomatix RegionMiner, “Over-represented transcription factor binding sites” based on MatInspector [31], [32]) of sequences under the NRL ChIP–Seq peaks. As predicted, we noticed a significant enrichment of the binding sites for NRL and other AP1 related factors (AP1R) in peaks associated with genes that are up - or down-regulated in the absence of Nrl (Table S2).
An unbiased motif enrichment analysis of ChIP–Seq peak regions for NRL targets revealed binding sites for transcription factor families that include key photoreceptor regulatory proteins – CRX (BCDF family) [20], [24], [33], NR2E3 (NR2F family) [18], [19], [34], [35], RORβ (RORA family) [36], [37], ESRRβ (EREF family) [38] and MEF2C (MEF2 family) [39] (Table S2). Motifs for these transcription factors were significantly enriched within total NRL ChIP–Seq peaks and within the peaks associated with genes that are differentially expressed in Nrl−/− photoreceptors (except for MEF2C in ABI data) (Figure 2C). The motifs for AP1R (NRL), BCDF (CRX), RORA (RORβ) and EREF (ESRRβ) families were located close to the peak center whereas motifs for NR2E3 and MEF2C were not (Figure 2C). The composition and enrichment ranking of enriched transcription factor motifs were different between NRL target genes whose expression was down - or up-regulated in Nrl−/− photoreceptors (Table S2), suggesting that NRL cooperated with different proteins to activate or repress gene expression. However, the genomic distribution of NRL peaks is similar among the various groups (Figure S1).
As CRX is an established transcriptional activator of photoreceptor genes [21] and is shown to interact with NRL [24], we integrated NRL ChIP–Seq peaks with the previously published CRX ChIP–Seq data [22]. Interestingly, 65% of NRL ChIP–Seq peaks obtained from Illumina and 48% of those from ABI overlapped with the CRX peaks (Figure 2D), consistent with a previous finding that 51% of the down-regulated genes in Nrl−/− mice exhibit reduced expression in Crx−/− retina as well [40]. Motif enrichment analysis of NRL-CRX-overlapping peak regions and of non CRX-overlapping peaks revealed AP1R binding site (NRL) as the only common motif (Table S3). The motifs for other photoreceptor transcription factors ESRRβ, RORβ, NR2E3 were only enriched in NRL-CRX-overlapping peaks, and the most enriched motif for non CRX-overlapping NRL peaks was for SP1 family proteins (Table S3).
Ontology analysis revealed distinct biological functions for genes that were associated with NRL-CRX-overlapping ChIP–Seq peaks (involved in photoreceptor function) versus genes associated with non CRX-overlapping NRL peaks (basic cellular processes) (Table S4).
Validation of In Vivo NRL Occupancy
We first checked Illumina and ABI ChIP–Seq data for a few established NRL target genes that are involved in rod development or function (Figure 3). In addition to the reported NRL-binding sequences (at −75 bp for Rho and −3.5 kb for Nr2e3) [41], [42], [43], ChIP–Seq data further identified binding sites for NRL in Rho at −3 kb and −1.5 kb and in Nr2e3 at −1 kb and −100 bp. We also detected NRL binding in rod-specific genes (such as Pde6a, Gnat1) and Esrrb, an important regulator of rod gene expression [38]; the expression of these genes is decreased significantly in Nrl−/− mice. In Esrrb, we identified strong NRL binding to the second intron. Interestingly, a strong NRL ChIP–Seq peak was observed within an intron of the Nrl gene in addition to a peak in the promoter region. Kdm5b and Wisp1 are among additional genes that are regulated by NRL and play a role in rod homeostasis (see later). NRL also binds to cone-specific genes and may contribute to their down-regulation to maintain a rod phenotype, as proposed previously [11], [41].
Fig. 3. Visualization of NRL ChIP–Seq peaks and CRX ChIP–Seq peaks. 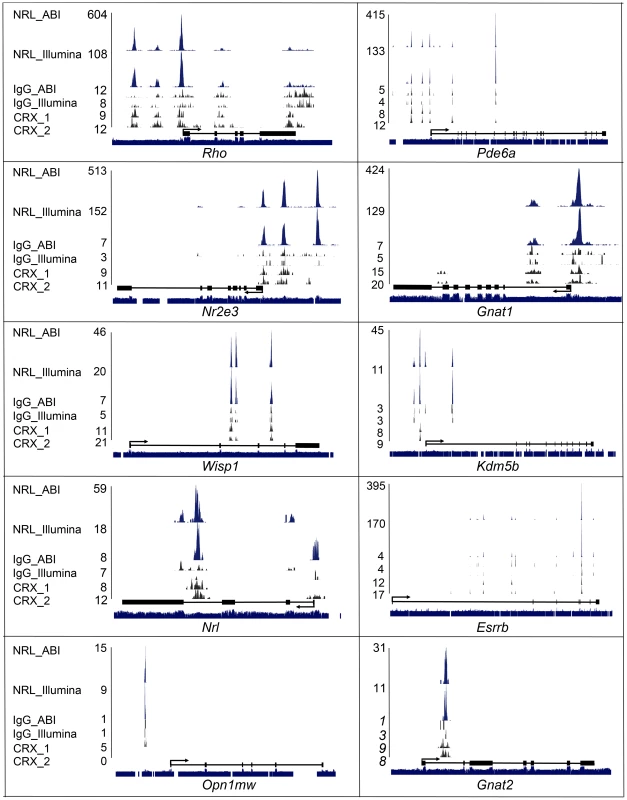
NRL and CRX ChIP–Seq peaks for known and novel NRL target genes were visualized with the UCSC genome browser. NRL peaks (in blue), IgG peaks (in black) and CRX peaks (in black) represent the numbers of sequence tags detected at each location and the numbers are the peak-summit count. Exon (Black box) and intron (black line) structure are shown below peaks. Species conservation is shown at the bottom. NRL_ABI and NRL_Illumina: NRL ChIP–Seq using ABI sequencing platform and illumina sequencing platform, respectively. IgG_ABI and IgG_Illumina: IgG control ChIP–Seq using ABI sequencing platform and illumina sequencing platform, respectively. CRX_1 and CRX_2: duplicate CRX ChIP–Seq data using Illumina sequencing platform. In general, ABI ChIP–Seq peaks were higher than Illumina peaks although uniquely mapped reads in the two libraries were comparable (5.3 million vs 6.3 million) (Figure 3). Even though ABI data produced more peaks (e.g., Kdm5b and Nrl), Illumina data detected unique peaks that were not present in ABI (e.g., Esrrb) (Figure 3). We then plotted CRX ChIP–Seq peaks [22] relative to NRL peaks.
We then performed ChIP-qPCR validations for a number of known and novel NRL targets. To strictly control the ChIP-qPCR analyses, we used two sets of controls: normal IgG as an antibody control and retina from Nrl −/− mice as a tissue control. We compared ChIP-qPCR signals between anti-NRL antibody and normal IgG using WT mouse retina, and performed additional NRL ChIP analysis using WT and Nrl−/− mouse retina (Figure 4). The two sets of experiments were highly concordant and validated the ChIP–Seq findings for all 26 sites (with various ChIP–Seq peak heights) that were tested. ChIP-qPCR analysis did not detect the association of NRL with 5 genomic regions that did not include ChIP–Seq peaks (Figure 4).
Fig. 4. Validation of NRL binding to corresponding peak regions by ChIP–qPCR. 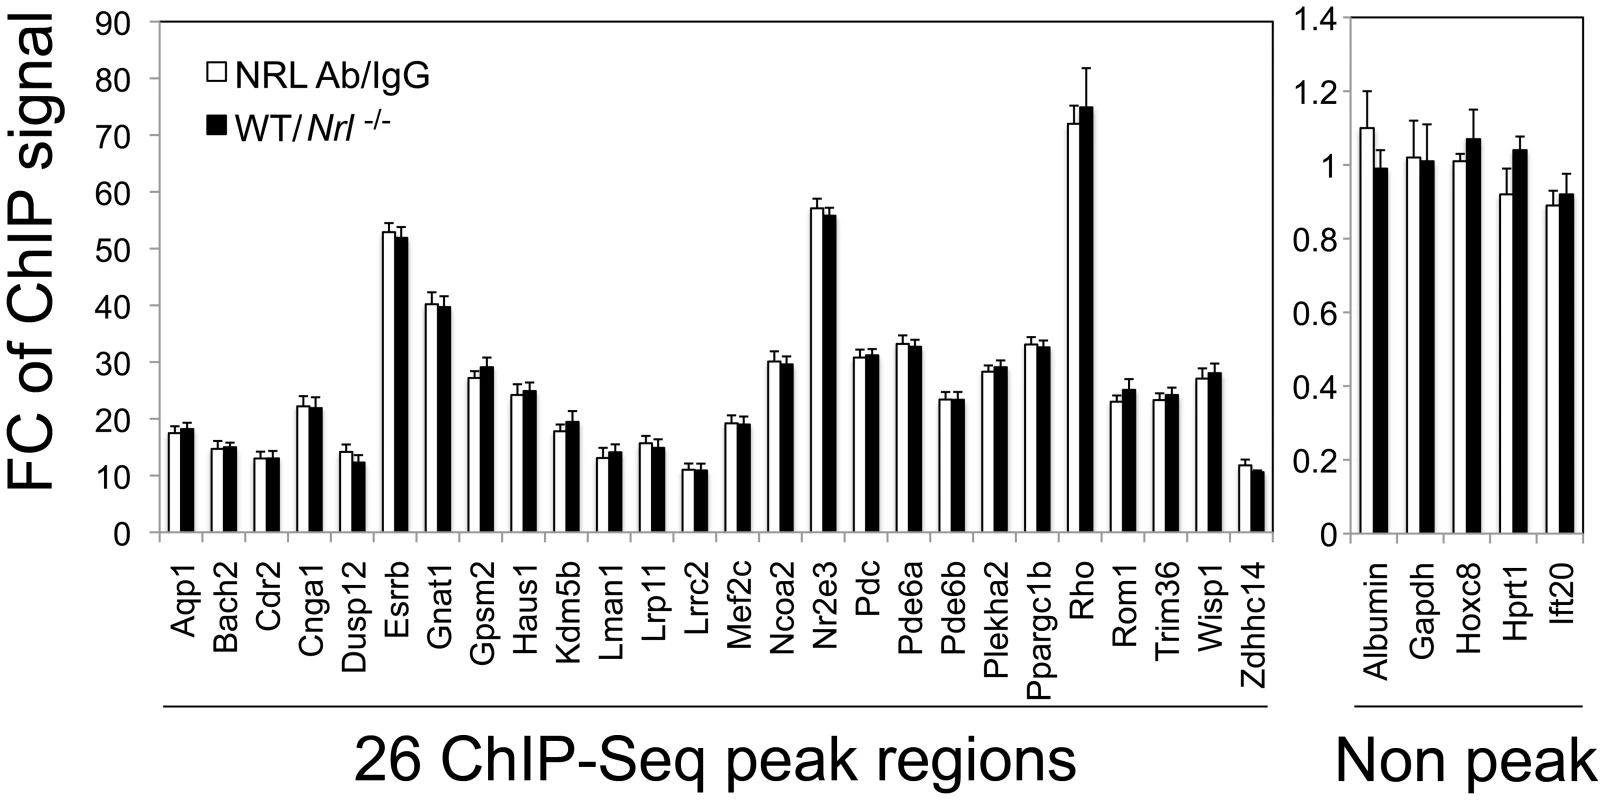
ChIP-qPCR was performed to validate NRL binding to 26 ChIP–Seq peak regions (left panel), and 5 non-peak regions (right panel) served as negative controls. The amount of ChIP DNA was measured by qPCR in triplicates using primers flanking the regions of interest. Normal IgG served as an antibody control when ChIP was performed using WT retinas (white bars). White bars (NRL Ab/IgG) represent fold change (FC) of qPCR signals comparing NRL ChIP DNA to the IgG control ChIP DNA. A separate set of ChIP assays was performed using NRL antibody to compare signals from WT retina to signals from Nrl−/− retina (tissue control). Black bars (WT/Nrl−/−) represent fold increase (Fc) of qPCR signals comparing NRL ChIP DNA from wild type C57BL/6 mouse retina to NRL ChIP DNA from Nrl−/− mouse retina. The ChIP-qPCR assays were performed twice. The representative results were shown as mean ± SD. P<0.01 for all by Student's t test. ChIP–Seq Peak Sequences Function as Enhancer Elements
To further test the functional relevance of NRL genome occupancy detected by ChIP–Seq, we generated enhancer-reporter constructs by cloning 26 randomly chosen ChIP–Seq peak regions (with a linear range of peak tags) and 5 non-peak genomic fragments of comparable sizes upstream of an SV40 basal promoter and a luciferase reporter gene. Of 26 NRL ChIP–Seq regions, at least 19 included CRX ChIP–Seq peaks. Five non-peak genomic fragments (3′Rho, 3′Pde6b, Gapdh, Hprt, Oct4) were negative for CRX peaks. Co-transfection of mouse NRL expression plasmid in HEK293T cells increased the luciferase reporter expression from all 26 enhancer constructs containing NRL ChIP–Seq peaks, but not from the 5 constructs containing non-peak fragments (Figure 5). Our data suggest that the genomic fragments spanning NRL ChIP–Seq peaks can function as enhancer elements and mediate NRL-driven transcriptional activation of target genes.
Fig. 5. Enhancer function of NRL ChIP–Seq regions in transfected HEK293T cells. 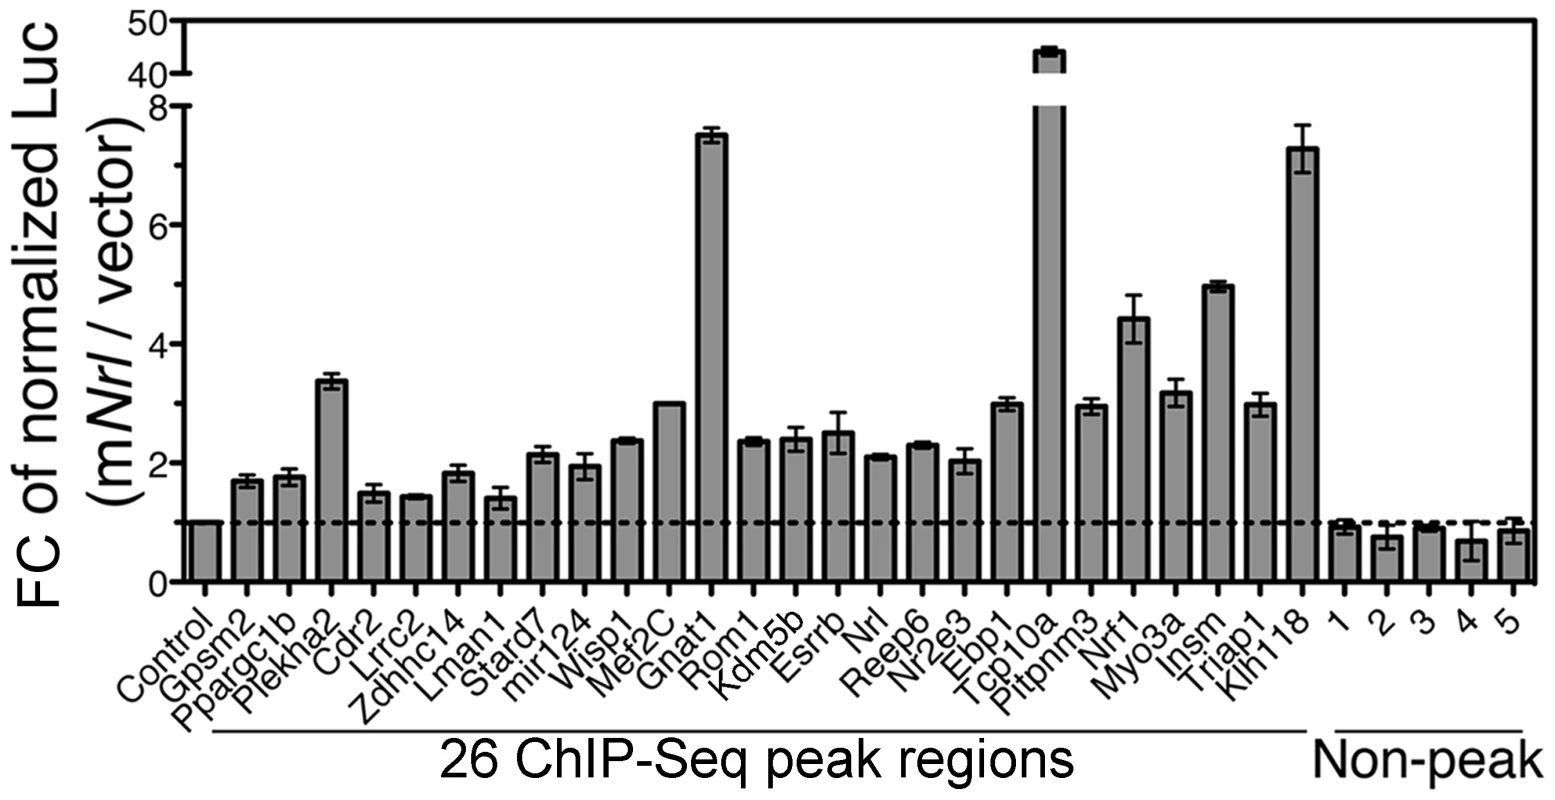
Twenty-six NRL peak regions were cloned into pGL3-promoter vector in front of a SV40 basal promoter and a luciferase reporter. The constructs were transfected in HEK293T cells together with mouse Nrl (mNrl) expression plasmid (in pC4C vector) or empty pC4C vector. The y-axis is fold change (Fc) of normalized luciferase readings. Control: enhancer constructs co-transfected with empty pC4C vector. Five non-peak regions served as additional negative controls. The experiments were performed three times. Representative results are shown as mean ± SD. P<0.05 for all by Student's t test. We also cloned and tested NRL peak regions associated with four cone genes (Gnat2, m-Opsin, Gngt2 and Pik3ap1) using the same reporter assay (2). Co-transfection of NRL expression plasmid increased the luciferase reporter expression from these enhancer constructs as well (Figure S2), validating the primary function of NRL as a transcriptional activator. However, we can not exclude the function of NRL in directly repressing cone genes in vivo as it may require interaction with native promoters and cis-elements, recruitment of appropriate cofactors, and/or native chromatin context, which are not provided in HEK293 cells.
NRL Target Genes as Candidates for Retinal Diseases
We hypothesized that NRL target genes would contribute to rod photoreceptor homeostasis, and their abnormal regulation could lead to photoreceptor dysfunction and/or degeneration. We therefore integrated the chromosomal location of the human orthologs of NRL target genes with mapping information for human genetic loci for retinal diseases (RetNet http://www.sph.uth.tmc.edu/retnet/). We identified 21 NRL target genes that are known to be associated with retinal diseases involving photoreceptor degeneration (Table S5). Furthermore, almost 100 human NRL target genes map within the critical region of 29 as yet uncloned retinal disease loci (Table S5).
In Vivo Functional Analysis of NRL Target Genes
To directly examine the physiological function of 16 NRL target genes, we knocked down the expression of target genes by transfecting shRNA plasmids in vivo into the P0 mouse retina [44], [45]. For each target gene, three shRNA expression constructs were first evaluated for knockdown efficiency using a sensor construct in HEK293T cells (Figure S3). The most efficient shRNA was then used for in vivo knockdown experiments in the mouse retina, which were examined seven or twenty days (at P7 or P20) after electroporation (Figure 6, Figure 7, and Figures S4, S5). A GFP-expression plasmid (Ub-GFP) was co-transfected to mark the transfected retinal cells. Based on putative function and/or involvement in retinal disease (see Table S5), we selected 16 genes – Bach2, Cdr2, Dusp12, Esrrb, Gpsm2, Haus1, Kdm5b, Lman1, Lrp11, Lrrc2, Ncoa2, Plekha2, Ppargc1b, Trim36, Wisp1 and Zdhhc14. Eight of the genes have overlapping CRX ChIP–Seq peaks.
Fig. 6. In vivo knockdown of NRL targets by shRNA sub-retinal injection and in vivo electroporation. 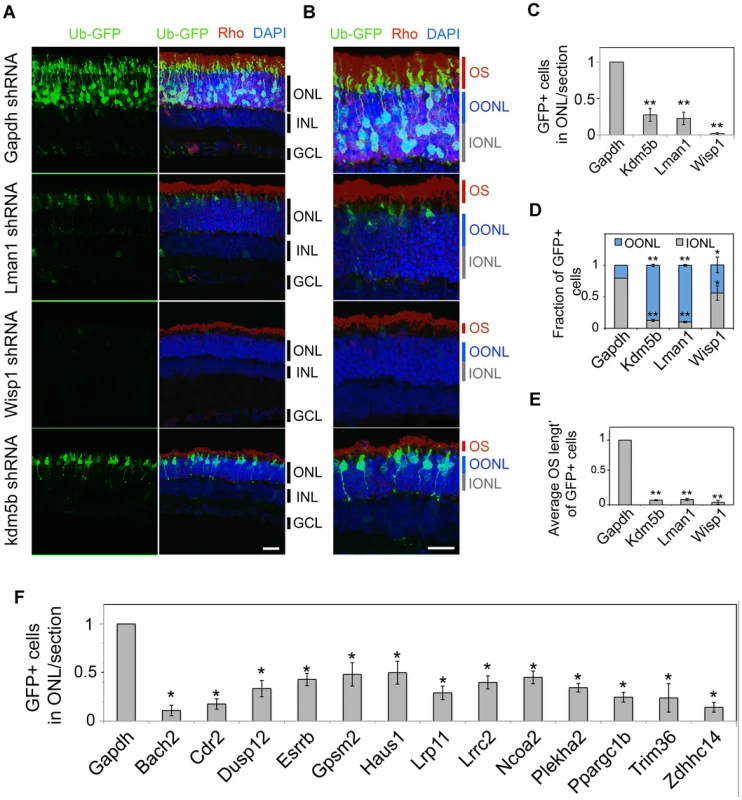
CD-1 mouse retinas were transfected at P0 with Ub-GFP and shRNA against Gapdh or NRL target genes by sub-retinal injection followed by in vivo electroporation (A–F). Retina were harvested at P20 and examined for GFP fluorescence (green), Rho immuno-reactivity (red) and DAPI staining (blue). At least 3 biological replicate retinas were collected and imaged. (A). ONL: outer nuclear layer. INL: inner nuclear layer. GCL: ganglion cell layer. Scale bar: 20 µM. (B) Higher magnification images of (A). OS: outer segment. OONL: outer portion of the outer nuclear layer. IONL: inner portion of the outer nuclear layer. Scale bar: 15 µM. GFP positive (+) cells in ONL were counted in sections of retinas electroporated with shRNA targeting Gapdh or NRL target genes (C, F). Distribution of electroporated cell bodies in the retina (D). Fraction of GFP positive cells in the retinal outer nuclear layer is calculated. OONL, outer portion of outer nuclear layer; IONL, inner portion of outer nuclear layer. Average outer segment (OS) length of electroporated cells was measured (E). Data are represented as mean ± SD. (C, D, E) *P<0.001, **P<0.0001 by Student's t test (n = 6 electroporated retinas). (F) *P<0.01 by Student's t test (n = 3 electroporated retinas). Fig. 7. Rescue of shRNA–knockdown with shRNA–resistant dcDNA. 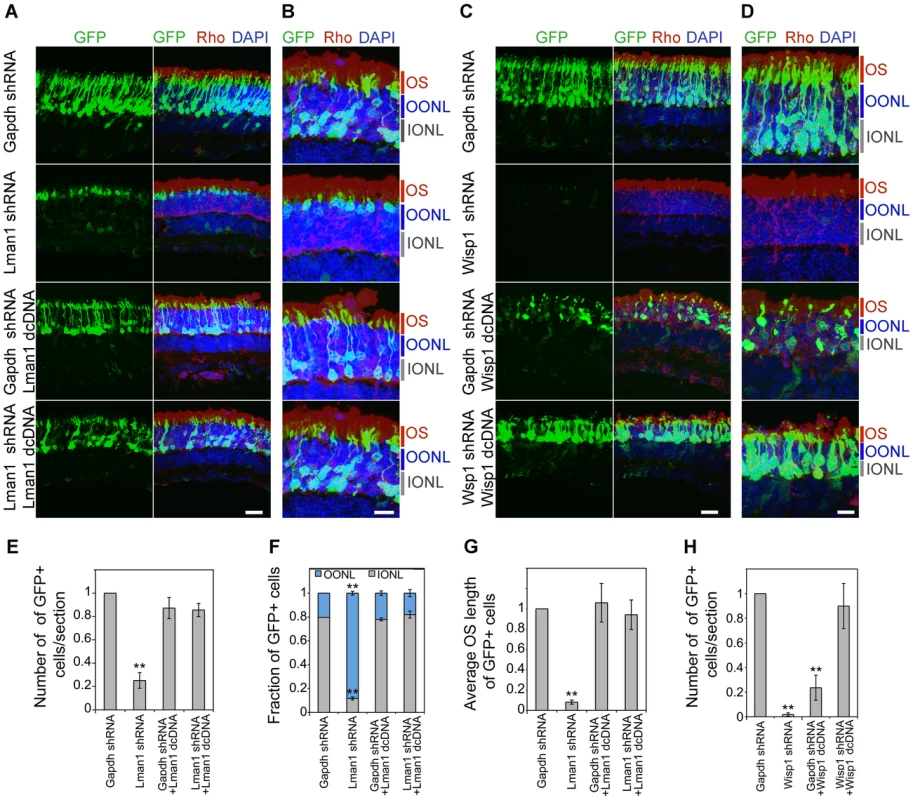
CD-1 mice were transfected at P0 with Ub-GFP and shRNA against Gapdh, Lman1 or Wisp1 by sub-retinal injection and in vivo electroporation. shRNA-resistant degenerate cDNA (dcDNA) was co-injected together with shRNA against Gapdh, Lman1 or Wisp1 for rescue experiments. Retinas were harvested at P20 and examined for GFP fluorescence (green), Rho immuno-reactivity (red) and DAPI staining (blue). Three biological replicate retinas were collected and imaged. (A, C). Scale bar: 20 µM. (B, D) Higher magnification images of (A, C). OS: outer segment. OONL: outer portion of the outer nuclear layer. IONL: inner portion of the outer nuclear layer. Scale bar: 10 µM. GFP positive (+) cells were counted in sections of retina electroporated with shRNA targeting Gapdh or NRL target genes (E, H). Distribution of electroporated cell bodies in the retina (F). Fraction of GFP positive cells in the retinal outer nuclear layer is counted. OONL, outer region of outer nuclear layer; IONL, inner region of outer nuclear layer. Average outer segment (OS) lengths of electroporated cells were measured (G). Data are represented as mean ± SD. (E–H) *P<0.01, **P<0.001 by Student's t test (n = 3 electroporated retinas). We consistently observed, in multiple biological replicates, smaller numbers of GFP+ cells in P20 retina that was transfected with shRNA against NRL target genes compared to the retina expressing control Gapdh shRNA (Figure 6, Figure 7, and Figure S5). The reduction in the number of GFP+ cells was more pronounced at P20 than at P7, and was most severe in retina transfected with Wisp1 shRNA, which led to a near total and consistent loss of GFP+ cells at P20. Thus, the function of a majority of NRL targets appears to be required for functional maintenance of photoreceptors.
In addition to the reduced number of GFP+ cells, the knockdown of Kdm5b, Lman1, or Wisp1 resulted in an abnormal morphology of the transfected photoreceptors at P20, including the abnormal location of their cell bodies (Figure 6A, 6B, and 6D) and short outer segments (Figure 6A, 6B, and 6E). The cell bodies of the GFP+ cells were positioned in the outer portion of the outer nuclear layer (ONL), reminiscent of cone nuclei [46], instead of spanning across the ONL (Figure 6).
To validate the specificity of knockdown data and rule out the possibility of general toxic effects of shRNA, we produced degenerate cDNA (dcDNA) constructs for two of the target genes (Lman1 and Wisp1) containing silent mutations that conferred resistance to shRNA mediated mRNA degradation. Co-transfection of Gapdh shRNA with dcDNA for Lman1 did not manifest a retinal phenotype, and more importantly, Lman1 dcDNA co-transfection rescued all of the Lman1 shRNA phenotypes in the retina (including the reduced number of GFP+ cells, cell body location and OS length) (Figure 7). Co-transfection with Wisp1 dcDNA also corrected the reduction of GFP+ cells; however, its overexpression led to a decrease in GFP+ cells (Figure 7), indicating that endogenous WISP1 levels are carefully controlled.
KDM5b Functions as a Secondary Regulatory Node
We were particularly intrigued by one of the NRL targets – Kdm5b (see Figure 6), which encodes lysine (K)-specific demethylase 5b, an enzyme that catalyzes the demethylation of active histone marks at methylated H3K4; thus, Kdm5b is involved in chromatin remodeling and functions as a transcriptional repressor [47], [48], [49]. To investigate its potential role as a second order node in photoreceptor GRN downstream of NRL, we dissociated the retina 20 days after knocking down Kdm5b or Gapdh expression by shRNA electroporation at P0, flow-sorted the electroporated cells, prepared total RNA, and performed global expression profiling using Affymetrix exon arrays (Figure 8A). Kdm5b knockdown resulted in up-regulation of 311 genes and down-regulation of 619 genes when compared to Gapdh knockdown. We detected 57 genes that are down-regulated and 20 that are up-regulated in both Kdm5b knockdown and Nrl−/− retina (Figure 8B), suggesting that some of the effects of loss of NRL (in Nrl−/− retina) are mediated through decreased Kdm5b expression. Some of the genes (e.g., Pde6a, Pde6b, Guca1b, Pde6c, Cngb3, Opn1sw) altered by Kdm5b knockdown are associated with the visual transduction, while a few others (Gadd45a, H2afz and Suv39h2) are associated with chromatin organization [50], [51], [52].
Fig. 8. Microarray analysis of flow-sorted photoreceptors after in vivo Kdm5b knockdown. 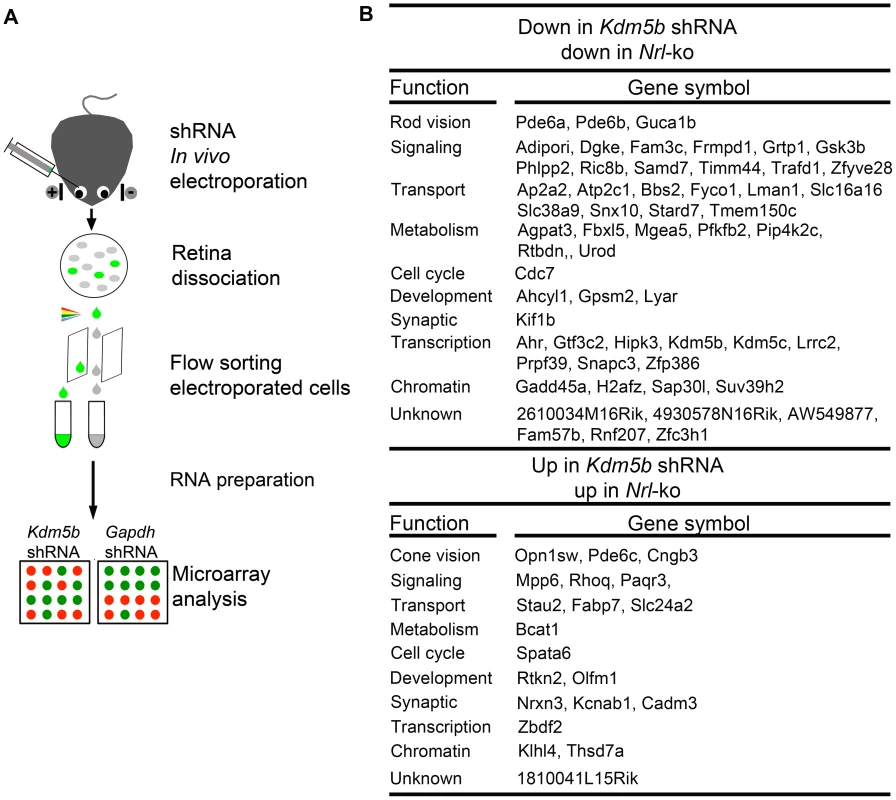
(A) Experimental workflow. CD-1 mouse retinas were transfected at P0 with Ub-GFP and shRNA against Gapdh or Kdm5b by sub-retinal injection and in vivo electroporation. Retinas were dissociated at P20 and shRNA-transfected retinal cells were isolated by flow-sorting. The effect of Kdm5b shRNA on transcriptional profile was measured by microarray analysis. (B) Ontology analysis of common targets of KDM5b and NRL. Kdm5b shRNA up: genes that are up-regulated in retinal cells electroporated with Kdm5b shRNA. Kdm5b shRNA down: genes that are down-regulated in retinal cells electroporated with Kdm5b shRNA. Nrl-ko up: genes that are up-regulated in Nrl−/− photoreceptor cells. Nrl-ko down: genes that are down-regulated in Nrl−/− photorceptor cells. Discussion
Visual impairment in a vast majority of retinal and macular degenerative diseases can be attributed to dysfunction or death of photoreceptors [7], [10], [11]. Despite the central role of cones in transduction of vision in humans, rods constitute 95% of all photoreceptors and are generally the first to die in retinal neurodegeneration. A relatively late onset of clinical manifestations in these diseases underscores the importance of stringently maintaining the function of highly metabolically active photoreceptors. The control of homeostasis must be exerted at multiple levels as quantitatively precise expression of phototransduction proteins and their transport to the modified sensory cilia (outer segments) are critical for photoreceptor survival. In addition to its essential role in photoreceptor differentiation, NRL has been implicated in the regulation of rod phototransduction genes, such as rhodopsin and cGMP phosphodiesterase α and β subunits [24], [27], [53], [54]. Here we identify global transcriptional targets of NRL and integrate our data with reported targets of CRX, another key regulator of photoreceptor genes. Our results show that NRL and CRX together control the expression of most, if not all, genes involved in rod phototransduction through a cis-regulatory module, which also includes the binding sites for NR2E3, ESRRβ, RORβ and in some cases MEF2C. Equally important is the finding that non-CRX containing NRL cis-regulatory modules fine-tune the expression of additional photoreceptor-expressed genes, which may contribute to high metabolic demand in rod photoreceptors.
ChIP–Seq has emerged as a cost effective, high-throughput technology for high-resolution genome-wide mapping of in vivo locations for chromatin modifications and transcription factor binding [55], [56], [57], [58]. Despite the fundamental difference in sequencing chemistry and nucleotide base calling software between the Illumina and ABI/SOLiD sequencing platforms [59], [60], our ChIP–Seq data from the two are remarkably comparable, further validating the in vivo NRL binding events reported here. In addition to enrichment in promoter regions, a number of NRL ChIP–Seq peaks are detected in intronic regions of annotated genes; some of these might reflect alternative promoter usage in photoreceptors as reported recently for Mef2c [39].
We previously proposed that photoreceptor precursors have a “default” S-cone fate and a “tug-of-war” among a selected few transcription factors specifies rod versus cone cell type [11]. NRL and TRβ2 respectively initiate the rod and M-cone pathways [16], with NRL being the dominant activator of rod genes and a suppressor of cone genes together with its target NR2E3 [15], [41]. Enrichment of a distinct set of transcription factor binding sites in NRL ChIP–Seq peaks in genes that are down - or up-regulated in Nrl−/− retina suggests specific and discrete cis-regulatory modules for rod versus cone photoreceptor expressed genes. CRX strongly activates the expression of both rod and cone genes [21], [22], [61]. An overlap of CRX peaks in over 50% of NRL ChIP–Seq peaks is consistent with their synergistic function in activating rod-expressed genes. Indeed, all rod phototransduction genes were included in this group. Notably, CRX ChIP–Seq peaks are much smaller than NRL peaks at the same loci and loss of NRL leads to more significant decrease in gene expression than in Crx−/− retina, suggesting a fundamental role of NRL in regulating rod genes. CRX likely enhances rod gene expression by altering the chromatin conformation via recruitment of histone acetylases [62]. In cone genes (up-regulated in Nrl−/− retina), binding of both CRX and NRL is consistent with the common photoreceptor precursor hypothesis [11], [16]. Additional studies (e.g., histone modifications) are needed to clarify differential regulation of specific genes by NRL and CRX in rod versus cone photoreceptors.
Like many key transcription factor nodes in GRNs [63], [64], [65], NRL likely auto-regulates its own expression as suggested by strong NRL ChIP–Seq peaks in Nrl promoter and intronic regions. While the key role of NR2E3 as a secondary node downstream of NRL is to repress cone-specific genes [17], [18], [41], two newly reported NRL targets – ESRRβ and MEF2C – function as transcriptional regulators for activation and/or maintenance of rod gene expression [38], [39]. A new secondary node in rod GRN that our studies identified is KDM5B (also called Jarid1b), a Jumonji-domain containing histone demethylase, which is associated with chromatin remodeling and transcriptional repression [47], [48]. KDM5B reportedly activates the expression of self-renewal-associated genes by suppressing cryptic initiation and maintaining proper H3K4me3 gradient for productive transcriptional elongation [66]. We observe a significant overlap between the genes altered by loss of NRL and KDM5B, indicating a broader role of KDM5B in regulating rod homeostasis downstream of NRL. We hypothesize that differential expression of KDM5B may contribute to chromatin organization and metabolic differences between rod and cone photoreceptors [8], [46], [67], [68].
Retinal and macular diseases are genetically heterogeneous with over 200 mapped loci; of these, almost 150 genes have been identified (http://www.sph.uth.tmc.edu/Retnet/). A catalog of genome-wide NRL targets with overlapping CRX binding sites, reported here, provides excellent candidate genes for mutation screening in patients with inherited retinal neurodegenerative diseases. We have listed almost 100 genes (see Table S5) that map to retinal disease loci. Interestingly, knockdown of 16 target genes, reported in this study, resulted in photoreceptor cell death or abnormal morphology, highlighting the importance of NRL targets in maintaining normal physiology and the association of perturbed target gene expression with retinal diseases.
A key aspect of photoreceptor homeostasis is the daily renewal of almost 10% of outer segment membrane discs, which requires a stringent control of the synthesis of specific phototransduction proteins and lipid molecules. Therefore, the target gene, Lman1, attracted our attention as its knockdown led to shorter photoreceptor outer segments and abnormal location of cell bodies (close to the sclera), which is characteristic of cone photoreceptors or late-born rods, whereas the early-born rods locate towards the vitreous side. LMAN1 participates in transport between the endoplasmic reticulum and Golgi [69]. Our data suggests that LMAN1 performs critical roles in photoreceptor homeostasis by controlling lipid homeostasis and/or biogenesis of membrane discs. Abnormal location of nuclei to scleral side in photoreceptors after its knockdown by in vivo electroporation could be due to rod to cone transformation in the absence of NRL, or delayed rod birth as a result of abnormal signaling for rod fate determination.
Wisp1, another interesting target of NRL, encodes the Wnt1-inducible signaling pathway protein 1 that exerts cytoprotective and/or growth promoting effects [70], [71] by repressing p53 and activation of Akt kinase [72]. WISP1 could therefore act as a survival or maintenance factor for photoreceptors. Further investigations on WISP1 may yield new targets for neuroprotective strategies in retinal degeneration.
Gene regulatory networks (GRN) control multiple pathways during development and homeostasis and provide conceptual framework for elucidating disease mechanisms [2], [73]. Transcription factors reside near the top of GRNs; their abnormal expression and/or activity can cause widespread changes in target genes [74], [75]. Our studies demonstrate a pivotal role of NRL in controlling rod homeostasis by modulating the expression of numerous target genes, which in turn maintain distinct aspects of cell function and survival. Elucidation of combinatorial regulation of genes by NRL and its co-regulators (specifically CRX) and identification of distinct downstream nodes (such as KDM5B) provide a framework to construct GRN for functional maintenance in mammalian rod photoreceptors (Figure 9).
Fig. 9. A simplified gene regulatory network in rod and cone photoreceptors. 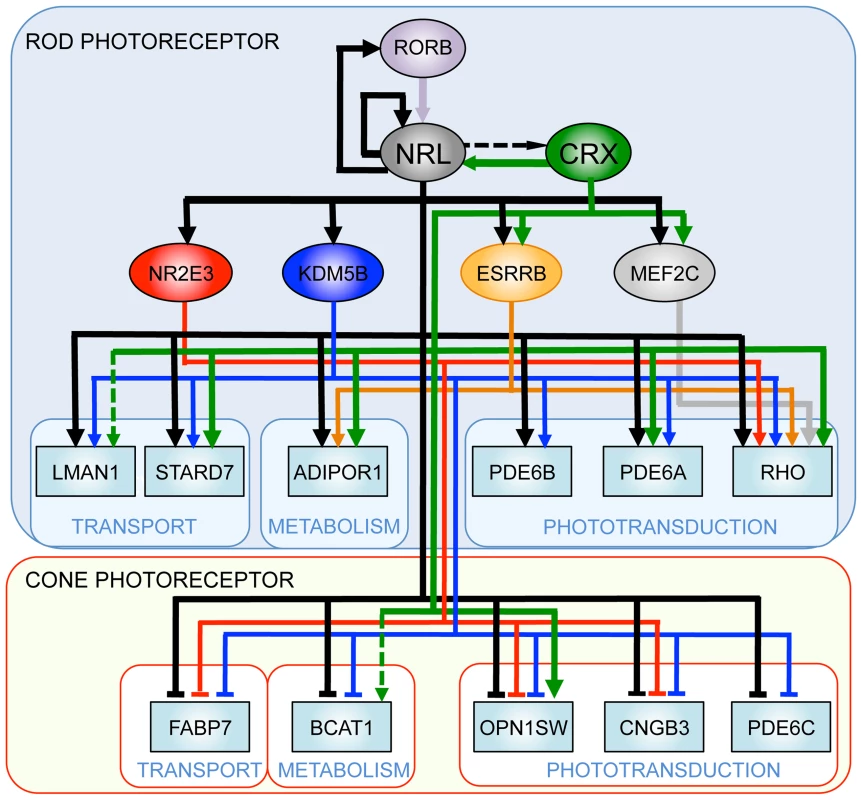
NRL acts synergistically with photoreceptor-specific transcription factors (such as CRX) and regulates the expression of rod and cone genes. Thin lines denote expression-based links, the dashed lines indicate links based on ChIP assays, and thick lines denote confirmed regulatory connections. Materials and Methods
All animal work must have been conducted according to relevant national and international guidelines. Animal Care and Use Committee of the National Eye Institute approved all mouse protocols. See also Text S1.
ChIP–Seq by Illumina and ABI/SOLiD Platforms
Retina from postnatal day (P) 28 C57Bl/6J mice was used for ChIP experiments with NRL antibody or normal IgG, as previously described [41]. Fifteen or 25 ng of ChIP DNA from parallel experiments was used for library preparation and sequencing on Illumina 1G Genome Analyzer or ABI SOLiD V2 system, respectively.
ChIP–Seq Data Analysis
Raw sequencing reads from Illumina or ABI platforms were mapped to the mouse genome (NCBI build 37) using Genomatix Mining Station (GMS).
ChIP–Seq peaks were called using MACS [28] and NGS-Analyzer (Genomatix). The union of overlapping peak regions from both methods was used in subsequent analyses.
Comparison of NRL ChIP–Seq Peaks with CRX ChIP–Seq Data
The NRL ChIP–Seq peaks were compared to the CRX ChIP–Seq regions [22] using GenomeInspector (Genomatix; [31]).
Gene Expression Analysis
Affymetrix microarray data from flow-sorted photoreceptors of WT and Nrl−/− retina [25] was analyzed using ChipInsepector (Genomatix).
Transcription Factor Enrichment Analysis
Transcription factor binding site enrichment analyses of sequences in ChIP–Seq peak regions were performed using RegionMiner and MatInspector (Genomatix; [31], [32]). The ChIP–Seq peaks were extended to −500 bp and +500 bp from the peak center. The sequences were scanned for TFBS matrices (Genomatix MatBase version 8.2) using MatInspector (Genomatix). Positional bias (P) was calculated [76], and the –log(P) was plotted against the scan windows' mid-positions. The over-represented TFBS positions for a TF family appear as peaks in these plots.
ChIP–Quantitative PCR (qPCR)
ChIP DNA was tested in triplicates by qPCR using SYBR Green [77]. We randomly tested 26 regions with peaks covering the majority range of the peak heights. Five regions without ChIP–Seq signals served as negative controls. Normal IgG served as the negative antibody control, and Nrl−/− retina was used as a negative tissue control. The complete ChIP-qPCR procedure was performed twice.
Cell Culture, Transfection, Plasmids, and Cloning
HEK293T cells were cultured in DMEM and transfected with Fugene 6 (Roche).
To generate shRNA-resistant dcDNA constructs, silent mutations that confer resistance to shRNA were introduced into Lman1 cDNA and Wisp1 cDNA using Quikchange kit (Stratagene).
Enhancer Analysis Using Luciferase Assays
To generate enhancer constructs, ChIP–Seq peak regions were amplified and cloned into pGL3-promoter vector (Promega). HEK293T cells were transfected with these enhancer constructs, a transfection control plasmid expressing Renilla luciferase (Promega), and NRL expression plasmid or empty vector. The luciferase activities were measured 48 hr after transfection. The experiments were performed three times.
shRNA–Sensor Assay
To generate shRNA-sensor constructs for efficiency test, we cloned the shRNA target sequences into the 3′UTR of a GFP vector. The shRNA-sensor construct and CAG-HcRed (transfection control) were co-transfected with either shRNA against target or Gapdh shRNA, For each target gene, three shRNA constructs were evaluated for efficacy indicated by a decrease in GFP. The most efficient one was chosen for in vivo knockdown experiments.
Sub-Retinal Injection and In Vivo Electroporation
shRNA alone or together with shRNA-resistant dcDNA was introduced in the retina of CD-1 P0 mouse pups by sub-retinal injection followed by in vivo electroporation, as previously described [44], [45]. The retinas were harvested at P7 or P20 for histology or immunohistochemistry.
Retina Dissociation, FACS Isolation, and Exon Arrays
Mouse retina was electroporated at P0 with Ub-GFP and Gapdh shRNA or Kdm5b shRNA and dissected at P20. GFP+ retinal cells were isolated from dissociated retina by FACS (FACSAria; BD Biosciences). RNA was extracted and cDNA was synthesized followed by sense transcript cDNA (ST-cDNA) generation using WT-Ovation Exon module (NuGEN Technologies). The ST-cDNA was fragmented and labeled with Encore Biotin Module (NuGen) and used for hybridization with GeneChip Mouse Exon 1.0 ST array (Affymetrix). The microarray data has been deposited in the Gene Expression Omnibus Database (accession #: will be available soon).
Supporting Information
Zdroje
1. PeterISDavidsonEH 2011 Evolution of gene regulatory networks controlling body plan development. Cell 144 970 985
2. LevineMTjianR 2003 Transcription regulation and animal diversity. Nature 424 147 151
3. LevineMDavidsonEH 2005 Gene regulatory networks for development. Proc Natl Acad Sci U S A 102 4936 4942
4. RamockiMBZoghbiHY 2008 Failure of neuronal homeostasis results in common neuropsychiatric phenotypes. Nature 455 912 918
5. MorrisonJHHofPR 1997 Life and death of neurons in the aging brain. Science 278 412 419
6. LuoDGXueTYauKW 2008 How vision begins: an odyssey. Proc Natl Acad Sci U S A 105 9855 9862
7. BramallANWrightAFJacobsonSGMcInnesRR 2010 The genomic, biochemical, and cellular responses of the retina in inherited photoreceptor degenerations and prospects for the treatment of these disorders. Annu Rev Neurosci 33 441 472
8. LambTDCollinSPPughENJr 2007 Evolution of the vertebrate eye: opsins, photoreceptors, retina and eye cup. Nat Rev Neurosci 8 960 976
9. JacksonGROwsleyCCurcioCA 2002 Photoreceptor degeneration and dysfunction in aging and age-related maculopathy. Ageing research reviews 1 381 396
10. WrightAFChakarovaCFAbd El-AzizMMBhattacharyaSS 2010 Photoreceptor degeneration: genetic and mechanistic dissection of a complex trait. Nat Rev Genet 11 273 284
11. SwaroopAKimDForrestD 2010 Transcriptional regulation of photoreceptor development and homeostasis in the mammalian retina. Nat Rev Neurosci 11 563 576
12. LiveseyFJCepkoCL 2001 Vertebrate neural cell-fate determination: lessons from the retina. Nat Rev Neurosci 2 109 118
13. AgathocleousMHarrisWA 2009 From progenitors to differentiated cells in the vertebrate retina. Annu Rev Cell Dev Biol 25 45 69
14. MearsAJKondoMSwainPKTakadaYBushRA 2001 Nrl is required for rod photoreceptor development. Nat Genet 29 447 452
15. OhECKhanNNovelliEKhannaHStrettoiE 2007 Transformation of cone precursors to functional rod photoreceptors by bZIP transcription factor NRL. Proc Natl Acad Sci U S A 104 1679 1684
16. NgLLuASwaroopASharlinDSForrestD 2011 Two transcription factors can direct three photoreceptor outcomes from rod precursor cells in mouse retinal development. J Neurosci 31 11118 11125
17. ChengHAlemanTSCideciyanAVKhannaRJacobsonSG 2006 In vivo function of the orphan nuclear receptor NR2E3 in establishing photoreceptor identity during mammalian retinal development. Hum Mol Genet 15 2588 2602
18. ChenJRattnerANathansJ 2005 The rod photoreceptor-specific nuclear receptor Nr2e3 represses transcription of multiple cone-specific genes. J Neurosci 25 118 129
19. PengGHAhmadOAhmadFLiuJChenS 2005 The photoreceptor-specific nuclear receptor Nr2e3 interacts with Crx and exerts opposing effects on the transcription of rod versus cone genes. Hum Mol Genet 14 747 764
20. FurukawaTMorrowEMLiTDavisFCCepkoCL 1999 Retinopathy and attenuated circadian entrainment in Crx-deficient mice. Nat Genet 23 466 470
21. HennigAKPengGHChenS 2008 Regulation of photoreceptor gene expression by Crx-associated transcription factor network. Brain Res 1192 114 133
22. CorboJCLawrenceKAKarlstetterMMyersCAAbdelazizM 2010 CRX ChIP–Seq reveals the cis-regulatory architecture of mouse photoreceptors. Genome Res 20 1512 1525
23. BrooksMJRajasimhaHKRogerJESwaroopA 2011 Next generation sequencing facilitates quantitative analysis of wild type and Nrl−/ − retinal transcriptomes. Mol Vis in press
24. MittonKPSwainPKChenSXuSZackDJ 2000 The leucine zipper of NRL interacts with the CRX homeodomain. A possible mechanism of transcriptional synergy in rhodopsin regulation. J Biol Chem 275 29794 29799
25. AkimotoMChengHZhuDBrzezinskiJAKhannaR 2006 Targeting of GFP to newborn rods by Nrl promoter and temporal expression profiling of flow-sorted photoreceptors. Proc Natl Acad Sci U S A 103 3890 3895
26. CorboJCMyersCALawrenceKAJadhavAPCepkoCL 2007 A typology of photoreceptor gene expression patterns in the mouse. Proc Natl Acad Sci U S A 104 12069 12074
27. YoshidaSMearsAJFriedmanJSCarterTHeS 2004 Expression profiling of the developing and mature Nrl−/ − mouse retina: identification of retinal disease candidates and transcriptional regulatory targets of Nrl. Hum Mol Genet 13 1487 1503
28. ZhangYLiuTMeyerCAEeckhouteJJohnsonDS 2008 Model-based analysis of ChIP–Seq (MACS). Genome Biol 9 R137
29. PtashneM 2005 Regulation of transcription: from lambda to eukaryotes. Trends Biochem Sci 30 275 279
30. PtashneMGannA 1997 Transcriptional activation by recruitment. Nature 386 569 577
31. QuandtKFrechKKarasHWingenderEWernerT 1995 MatInd and MatInspector: new fast and versatile tools for detection of consensus matches in nucleotide sequence data. Nucleic Acids Res 23 4878 4884
32. CarthariusKFrechKGroteKKlockeBHaltmeierM 2005 MatInspector and beyond: promoter analysis based on transcription factor binding sites. Bioinformatics 21 2933 2942
33. ChenSWangQLNieZSunHLennonG 1997 Crx, a novel Otx-like paired-homeodomain protein, binds to and transactivates photoreceptor cell-specific genes. Neuron 19 1017 1030
34. ChengHKhannaHOhECHicksDMittonKP 2004 Photoreceptor-specific nuclear receptor NR2E3 functions as a transcriptional activator in rod photoreceptors. Hum Mol Genet 13 1563 1575
35. HaiderNBJacobsonSGCideciyanAVSwiderskiRStrebLM 2000 Mutation of a nuclear receptor gene, NR2E3, causes enhanced S cone syndrome, a disorder of retinal cell fate. Nat Genet 24 127 131
36. JiaLOhECNgLSrinivasMBrooksM 2009 Retinoid-related orphan nuclear receptor RORbeta is an early-acting factor in rod photoreceptor development. Proc Natl Acad Sci U S A 106 17534 17539
37. SrinivasMNgLLiuHJiaLForrestD 2006 Activation of the blue opsin gene in cone photoreceptor development by retinoid-related orphan receptor beta. Mol Endocrinol 20 1728 1741
38. OnishiAPengGHPothEMLeeDAChenJ 2010 The orphan nuclear hormone receptor ERRbeta controls rod photoreceptor survival. Proc Natl Acad Sci U S A 107 11579 11584
39. HaoHTummalaPGuzmanEMaliRSGregorskiJ 2011 The transcription factor NRL controls photoreceptor-specific expression of myocyte enhancer factor Mef2c from an alternative promoter. J Biol Chem
40. HsiauTHDiaconuCMyersCALeeJCepkoCL 2007 The cis-regulatory logic of the mammalian photoreceptor transcriptional network. PLoS One 2 e643
41. OhECChengHHaoHJiaLKhanNW 2008 Rod differentiation factor NRL activates the expression of nuclear receptor NR2E3 to suppress the development of cone photoreceptors. Brain Res 1236 16 29
42. RehemtullaAWarwarRKumarRJiXZackDJ 1996 The basic motif-leucine zipper transcription factor Nrl can positively regulate rhodopsin gene expression. Proc Natl Acad Sci U S A 93 191 195
43. KumarRChenSScheurerDWangQLDuhE 1996 The bZIP transcription factor Nrl stimulates rhodopsin promoter activity in primary retinal cell cultures. J Biol Chem 271 29612 29618
44. KautzmannMAKimDSFelder-SchmittbuhlMPSwaroopA 2011 Combinatorial regulation of photoreceptor differentiation factor, neural retina leucine zipper gene NRL, revealed by in vivo promoter analysis. J Biol Chem 286 28247 28255
45. MatsudaTCepkoCL 2004 Electroporation and RNA interference in the rodent retina in vivo and in vitro. Proc Natl Acad Sci U S A 101 16 22
46. Carter-DawsonLDLaVailMM 1979 Rods and cones in the mouse retina. I. Structural analysis using light and electron microscopy. J Comp Neurol 188 245 262
47. SecombeJEisenmanRN 2007 The function and regulation of the JARID1 family of histone H3 lysine 4 demethylases: the Myc connection. Cell Cycle 6 1324 1328
48. KrishnakumarRKrausWL 2010 PARP-1 regulates chromatin structure and transcription through a KDM5B-dependent pathway. Mol Cell 39 736 749
49. YamaneKTateishiKKloseRJFangJFabrizioLA 2007 PLU-1 is an H3K4 demethylase involved in transcriptional repression and breast cancer cell proliferation. Mol Cell 25 801 812
50. HollanderMCSheikhMSBulavinDVLundgrenKAugeri-HenmuellerL 1999 Genomic instability in Gadd45a-deficient mice. Nat Genet 23 176 184
51. HardySJacquesPEGevryNForestAFortinME 2009 The euchromatic and heterochromatic landscapes are shaped by antagonizing effects of transcription on H2A.Z deposition. PLoS Genet 5 e1000687
52. PetersAHO'CarrollDScherthanHMechtlerKSauerS 2001 Loss of the Suv39h histone methyltransferases impairs mammalian heterochromatin and genome stability. Cell 107 323 337
53. PittlerSJZhangYChenSMearsAJZackDJ 2004 Functional analysis of the rod photoreceptor cGMP phosphodiesterase alpha-subunit gene promoter: Nrl and Crx are required for full transcriptional activity. J Biol Chem 279 19800 19807
54. LernerLEGribanovaYEJiMKnoxBEFarberDB 2001 Nrl and Sp nuclear proteins mediate transcription of rod-specific cGMP-phosphodiesterase beta-subunit gene: involvement of multiple response elements. J Biol Chem 276 34999 35007
55. BarskiACuddapahSCuiKRohTYSchonesDE 2007 High-resolution profiling of histone methylations in the human genome. Cell 129 823 837
56. JohnsonDSMortazaviAMyersRMWoldB 2007 Genome-wide mapping of in vivo protein-DNA interactions. Science 316 1497 1502
57. WangZZangCCuiKSchonesDEBarskiA 2009 Genome-wide mapping of HATs and HDACs reveals distinct functions in active and inactive genes. Cell 138 1019 1031
58. FujiwaraTO'GeenHKelesSBlahnikKLinnemannAK 2009 Discovering hematopoietic mechanisms through genome-wide analysis of GATA factor chromatin occupancy. Mol Cell 36 667 681
59. ShendureJJiH 2008 Next-generation DNA sequencing. Nat Biotechnol 26 1135 1145
60. ParkPJ 2009 ChIP–Seq: advantages and challenges of a maturing technology. Nat Rev Genet 10 669 680
61. MuranishiYSatoSInoueTUenoSKoyasuT 2010 Gene expression analysis of embryonic photoreceptor precursor cells using BAC-Crx-EGFP transgenic mouse. Biochem Biophys Res Comm 392 317 322
62. PengGHChenS 2007 Crx activates opsin transcription by recruiting HAT-containing co-activators and promoting histone acetylation. Hum Mol Genet 16 2433 2452
63. PeterISDavidsonEH 2011 A gene regulatory network controlling the embryonic specification of endoderm. Nature 474 635 639
64. SmithJTheodorisCDavidsonEH 2007 A gene regulatory network subcircuit drives a dynamic pattern of gene expression. Science 318 794 797
65. RisterJDesplanC 2010 Deciphering the genome's regulatory code: the many languages of DNA. Bio Essays 32 381 384
66. XieLPelzCWangWBasharAVarlamovaO 2011 KDM5B regulates embryonic stem cell self-renewal and represses cryptic intragenic transcription. EMBO J 30 1473 1484
67. SoloveiIKreysingMLanctotCKosemSPeichlL 2009 Nuclear architecture of rod photoreceptor cells adapts to vision in mammalian evolution. Cell 137 356 368
68. MustafiDKevanyBMGenoudCOkanoKCideciyanAV 2011 Defective photoreceptor phagocytosis in a mouse model of enhanced S-cone syndrome causes progressive retinal degeneration. FASEB J 25 3157 3176
69. NicholsWCGinsburgD 1999 From the ER to the golgi: insights from the study of combined factors V and VIII deficiency. Am J Hum Genet 64 1493 1498
70. XuLCorcoranRBWelshJWPennicaDLevineAJ 2000 WISP-1 is a Wnt-1 - and beta-catenin-responsive oncogene. Genes Dev 14 585 595
71. VenkatesanBPrabhuSDVenkatachalamKMummidiSValenteAJ 2010 WNT1-inducible signaling pathway protein-1 activates diverse cell survival pathways and blocks doxorubicin-induced cardiomyocyte death. Cell Signal 22 809 820
72. SuFOverholtzerMBesserDLevineAJ 2002 WISP-1 attenuates p53-mediated apoptosis in response to DNA damage through activation of the Akt kinase. Genes Dev 16 46 57
73. Ben-Tabou de-LeonSDavidsonEH 2007 Gene regulation: gene control network in development. Annu Rev Biophys Biomol Struct 36 191
74. BoyadjievSAJabsEW 2000 Online Mendelian Inheritance in Man (OMIM) as a knowledgebase for human developmental disorders. Clin Genet 57 253 266
75. VaquerizasJMKummerfeldSKTeichmannSALuscombeNM 2009 A census of human transcription factors: function, expression and evolution. Nat Rev Genet 10 252 263
76. HughesJDEstepPWTavazoieSChurchGM 2000 Computational identification of cis-regulatory elements associated with groups of functionally related genes in Saccharomyces cerevisiae. J Mol Biol 296 1205 1214
77. ZipperHBrunnerHBernhagenJVitzthumF 2004 Investigations on DNA intercalation and surface binding by SYBR Green I, its structure determination and methodological implications. Nucleic Acids Res 32 e103
Štítky
Genetika Reprodukčná medicína
Článek A Genome-Wide Screen for Genetic Variants That Modify the Recruitment of REST to Its Target GenesČlánek Population Structure of Hispanics in the United States: The Multi-Ethnic Study of AtherosclerosisČlánek Differing Requirements for RAD51 and DMC1 in Meiotic Pairing of Centromeres and Chromosome Arms inČlánek Cell Contact–Dependent Outer Membrane Exchange in Myxobacteria: Genetic Determinants and MechanismČlánek Formation of Rigid, Non-Flight Forewings (Elytra) of a Beetle Requires Two Major Cuticular Proteins
Článok vyšiel v časopisePLOS Genetics
Najčítanejšie tento týždeň
2012 Číslo 4- Gynekologové a odborníci na reprodukční medicínu se sejdou na prvním virtuálním summitu
- Je „freeze-all“ pro všechny? Odborníci na fertilitu diskutovali na virtuálním summitu
-
Všetky články tohto čísla
- Runs of Homozygosity Implicate Autozygosity as a Schizophrenia Risk Factor
- Modifier Genes and the Plasticity of Genetic Networks in Mice
- The DSIF Subunits Spt4 and Spt5 Have Distinct Roles at Various Phases of Immunoglobulin Class Switch Recombination
- A Genome-Wide Screen for Genetic Variants That Modify the Recruitment of REST to Its Target Genes
- Population Structure of Hispanics in the United States: The Multi-Ethnic Study of Atherosclerosis
- Deep Sequencing of Plant and Animal DNA Contained within Traditional Chinese Medicines Reveals Legality Issues and Health Safety Concerns
- Differing Requirements for RAD51 and DMC1 in Meiotic Pairing of Centromeres and Chromosome Arms in
- Insulin Signaling Mediates Sexual Attractiveness in
- Progressive Telomere Dysfunction Causes Cytokinesis Failure and Leads to the Accumulation of Polyploid Cells
- Long-Range Chromosome Organization in : A Site-Specific System Isolates the Ter Macrodomain
- Regulation of Budding Yeast Mating-Type Switching Donor Preference by the FHA Domain of Fkh1
- Polyglutamine Toxicity Is Controlled by Prion Composition and Gene Dosage in Yeast
- Patterns of Regulatory Variation in Diverse Human Populations
- Sequence-Specific Targeting of Dosage Compensation in Favors an Active Chromatin Context
- Whole-Exome Sequencing and Homozygosity Analysis Implicate Depolarization-Regulated Neuronal Genes in Autism
- Replication Fork Reversal after Replication–Transcription Collision
- Common Variants at 9p21 and 8q22 Are Associated with Increased Susceptibility to Optic Nerve Degeneration in Glaucoma
- Coordinate Regulation of Lipid Metabolism by Novel Nuclear Receptor Partnerships
- Epigenome-Wide Scans Identify Differentially Methylated Regions for Age and Age-Related Phenotypes in a Healthy Ageing Population
- A Coordinated Interdependent Protein Circuitry Stabilizes the Kinetochore Ensemble to Protect CENP-A in the Human Pathogenic Yeast
- Budding Yeast Dma Proteins Control Septin Dynamics and the Spindle Position Checkpoint by Promoting the Recruitment of the Elm1 Kinase to the Bud Neck
- , a Homolog of a Deaf-Blindness Gene, Regulates Circadian Output and Slowpoke Channels
- Transcriptional Regulation of Rod Photoreceptor Homeostasis Revealed by NRL Targetome Analysis
- Cell Contact–Dependent Outer Membrane Exchange in Myxobacteria: Genetic Determinants and Mechanism
- Defective Membrane Remodeling in Neuromuscular Diseases: Insights from Animal Models
- Formation of Rigid, Non-Flight Forewings (Elytra) of a Beetle Requires Two Major Cuticular Proteins
- SPE-44 Implements Sperm Cell Fate
- A Shared Role for RBF1 and dCAP-D3 in the Regulation of Transcription with Consequences for Innate Immunity
- A Companion Cell–Dominant and Developmentally Regulated H3K4 Demethylase Controls Flowering Time in via the Repression of Expression
- The HEN1 Ortholog, HENN-1, Methylates and Stabilizes Select Subclasses of Germline Small RNAs
- Improved Statistics for Genome-Wide Interaction Analysis
- The Probability of a Gene Tree Topology within a Phylogenetic Network with Applications to Hybridization Detection
- Context-Dependent Dual Role of SKI8 Homologs in mRNA Synthesis and Turnover
- Mu Insertions Are Repaired by the Double-Strand Break Repair Pathway of
- Competition between Replicative and Translesion Polymerases during Homologous Recombination Repair in Drosophila
- An Unbiased Assessment of the Role of Imprinted Genes in an Intergenerational Model of Developmental Programming
- Type 2 Diabetes Risk Alleles Demonstrate Extreme Directional Differentiation among Human Populations, Compared to Other Diseases
- Mutations in and Cause “Splashed White” and Other White Spotting Phenotypes in Horses
- Fine-Scale Mapping of Natural Variation in Fly Fecundity Identifies Neuronal Domain of Expression and Function of an Aquaporin
- Dynamics of Brassinosteroid Response Modulated by Negative Regulator LIC in Rice
- Genetic Inhibition of Solute-Linked Carrier 39 Family Transporter 1 Ameliorates Aβ Pathology in a Model of Alzheimer's Disease
- The Functions of Mediator in Support a Role in Shaping Species-Specific Gene Expression
- Patterns of Ancestry, Signatures of Natural Selection, and Genetic Association with Stature in Western African Pygmies
- Dissection of Pol II Trigger Loop Function and Pol II Activity–Dependent Control of Start Site Selection
- PIWI Associated siRNAs and piRNAs Specifically Require the HEN1 Ortholog
- Genome-Wide Patterns of Gene Expression in Nature
- Hypoxia Disruption of Vertebrate CNS Pathfinding through EphrinB2 Is Rescued by Magnesium
- A New Role for Translation Initiation Factor 2 in Maintaining Genome Integrity
- Sex Reversal in C57BL/6J XY Mice Caused by Increased Expression of Ovarian Genes and Insufficient Activation of the Testis Determining Pathway
- The Rac GTP Exchange Factor TIAM-1 Acts with CDC-42 and the Guidance Receptor UNC-40/DCC in Neuronal Protrusion and Axon Guidance
- PLOS Genetics
- Archív čísel
- Aktuálne číslo
- Informácie o časopise
Najčítanejšie v tomto čísle- A Coordinated Interdependent Protein Circuitry Stabilizes the Kinetochore Ensemble to Protect CENP-A in the Human Pathogenic Yeast
- Coordinate Regulation of Lipid Metabolism by Novel Nuclear Receptor Partnerships
- Defective Membrane Remodeling in Neuromuscular Diseases: Insights from Animal Models
- Formation of Rigid, Non-Flight Forewings (Elytra) of a Beetle Requires Two Major Cuticular Proteins
Prihlásenie#ADS_BOTTOM_SCRIPTS#Zabudnuté hesloZadajte e-mailovú adresu, s ktorou ste vytvárali účet. Budú Vám na ňu zasielané informácie k nastaveniu nového hesla.
- Časopisy


