-
Články
- Časopisy
- Kurzy
- Témy
- Kongresy
- Videa
- Podcasty
Genome-Wide Association Study of Blood Pressure Extremes Identifies Variant near Associated with Hypertension
Hypertension is a heritable and major contributor to the global burden of disease. The sum of rare and common genetic variants robustly identified so far explain only 1%–2% of the population variation in BP and hypertension. This suggests the existence of more undiscovered common variants. We conducted a genome-wide association study in 1,621 hypertensive cases and 1,699 controls and follow-up validation analyses in 19,845 cases and 16,541 controls using an extreme case-control design. We identified a locus on chromosome 16 in the 5′ region of Uromodulin (UMOD; rs13333226, combined P value of 3.6×10⁻¹¹). The minor G allele is associated with a lower risk of hypertension (OR [95%CI]: 0.87 [0.84–0.91]), reduced urinary uromodulin excretion, better renal function; and each copy of the G allele is associated with a 7.7% reduction in risk of CVD events after adjusting for age, sex, BMI, and smoking status (H.R. = 0.923, 95% CI 0.860–0.991; p = 0.027). In a subset of 13,446 individuals with estimated glomerular filtration rate (eGFR) measurements, we show that rs13333226 is independently associated with hypertension (unadjusted for eGFR: 0.89 [0.83–0.96], p = 0.004; after eGFR adjustment: 0.89 [0.83–0.96], p = 0.003). In clinical functional studies, we also consistently show the minor G allele is associated with lower urinary uromodulin excretion. The exclusive expression of uromodulin in the thick portion of the ascending limb of Henle suggests a putative role of this variant in hypertension through an effect on sodium homeostasis. The newly discovered UMOD locus for hypertension has the potential to give new insights into the role of uromodulin in BP regulation and to identify novel drugable targets for reducing cardiovascular risk.
Published in the journal: Genome-Wide Association Study of Blood Pressure Extremes Identifies Variant near Associated with Hypertension. PLoS Genet 6(10): e32767. doi:10.1371/journal.pgen.1001177
Category: Research Article
doi: https://doi.org/10.1371/journal.pgen.1001177Summary
Hypertension is a heritable and major contributor to the global burden of disease. The sum of rare and common genetic variants robustly identified so far explain only 1%–2% of the population variation in BP and hypertension. This suggests the existence of more undiscovered common variants. We conducted a genome-wide association study in 1,621 hypertensive cases and 1,699 controls and follow-up validation analyses in 19,845 cases and 16,541 controls using an extreme case-control design. We identified a locus on chromosome 16 in the 5′ region of Uromodulin (UMOD; rs13333226, combined P value of 3.6×10⁻¹¹). The minor G allele is associated with a lower risk of hypertension (OR [95%CI]: 0.87 [0.84–0.91]), reduced urinary uromodulin excretion, better renal function; and each copy of the G allele is associated with a 7.7% reduction in risk of CVD events after adjusting for age, sex, BMI, and smoking status (H.R. = 0.923, 95% CI 0.860–0.991; p = 0.027). In a subset of 13,446 individuals with estimated glomerular filtration rate (eGFR) measurements, we show that rs13333226 is independently associated with hypertension (unadjusted for eGFR: 0.89 [0.83–0.96], p = 0.004; after eGFR adjustment: 0.89 [0.83–0.96], p = 0.003). In clinical functional studies, we also consistently show the minor G allele is associated with lower urinary uromodulin excretion. The exclusive expression of uromodulin in the thick portion of the ascending limb of Henle suggests a putative role of this variant in hypertension through an effect on sodium homeostasis. The newly discovered UMOD locus for hypertension has the potential to give new insights into the role of uromodulin in BP regulation and to identify novel drugable targets for reducing cardiovascular risk.
Introduction
Hypertension is a major cardiovascular risk factor with a global prevalence of 26.4% in 2000, projected to increase to 29.2% by 2025, and is the leading contributor to global mortality[1], [2]. While epidemiologically BP is a trait continuously associated with an increased risk of cardiovascular mortality and morbidity, clinical risk assessment is necessarily based on a predefined threshold at which the quantitative BP phenotype is converted into a binary trait (hypertension) [3]–[6]. The main justification for large scale efforts to determine the genetic underpinnings of BP regulation is to identify new pharmacological targets for BP reduction while advancing our understanding of blood pressure regulation. This in turn could lead to novel prevention strategies to reduce the growing public health burden of hypertension-related cardiovascular disease [2], [7]. Systemic blood pressure (BP) is determined primarily by cardiac output and total peripheral resistance, which are controlled by a complex network of interacting pathways involving renal, neural, endocrine, vascular and environmental factors. So far, the search for common variants affecting BP has identified thirteen loci from two large meta-analyses consortia, with each association explaining only a very small proportion of the total variation in systolic or diastolic blood pressure (SBP or DBP; ∼0.05–0.10%, approximately 1 mmHg per allele SBP or 0.5 mmHg per allele DBP)[8], [9]. The sum of rare and common genetic variants robustly identified so far through linkage and genome wide association studies explain only 1–2% of the population variation in BP and hypertension. These data suggest the existence of more undiscovered blood pressure related common variants. Cross-sectional studies of the general population have required extremely large sample sizes to detect such small effect sizes [10]. In this paper we explored an alternative strategy to increase power, using cases and controls drawn from the extremes of the BP distribution, and detected a novel locus associated with hypertension. We then validated this association using large-scale population and case-control studies, where similar extreme criteria for selection of cases and controls have been used. As the locus was related to uromodulin, a protein exclusively expressed intrarenally, we tested for dependency of the association on renal function (eGFR) and urinary excretion of uromodulin. Finally, we tested associations with cardiovascular outcomes.
Results
Genome-wide association, replication, and meta-analysis
The demographic characteristics of the discovery and validation cohorts are presented in Table 1 and Table S1 respectively. The results of the GWAS in the discovery sample are presented in Figure 1. The observed versus expected p-value distributions (quantile-quantile plots) are shown in Figure 2. The top hit was rs13333226 with the minor G allele associated with a lower risk of hypertension (OR [95%CI]: 0.6 [0.5–0.73]; p = 1.14×10⁻⁷; Figure 3) and we selected this for validation in two stages (Figure S1, Table 2 and Table 3). In the first stage we genotyped rs13333226 in the MONICA/PAMELA population samples (in which we also genotyped an additional top 88 SNPs – Table S2) and in the larger MDC and MPP validation case-control populations. For the stage 1 validation, we had 9,827 cases and 8,694 controls and the combined analysis showed the minor G allele to be associated with a lower risk of hypertension (0.87 [0.82–0.92]; p = 3.6×10⁻⁶) after adjustment for age, age2 and BMI. Combined analysis of the 89 SNPs genotyped in the MONICA/PAMELA with the discovery cohort showed rs13333226 (p = 3.86×10⁻⁷) and rs4293393 (p = 3.30×10⁻⁷, r2 = 0.996) were the top SNPs. In stage 2 analysis which included 10,018 cases and 7,847 controls, the results were similar with the G allele associated with a lower risk of hypertension (0.86 [0.81–0.92]; p = 1.0×10⁻⁵). Combining stage 1 and stage 2 cohorts increased the strength of association (0.86 [0.83–0.90]; p = 1.61×10⁻¹⁰). There was no evidence of heterogeneity across the stage 1 or stage 2 samples or the combined stage 1 and 2 samples as tested by the Q statistic (p>0.05). Merging stages 1 and 2 with the discovery samples yielded the strongest association signal for rs13333226 (0.85 [0.81–0.89]; p = 1.5×10⁻¹³) with some evidence of heterogeneity (Q statistic p value = 0.04) introduced by the discovery cohort (Table 2, Figure 4A and 4B, Figure S2). This is probably due to the fact that the discovery cohort was ascertained using more extreme criteria than the replication cohorts. In the 13,446 individuals with eGFR measurements available, the strength of association of rs13333226 with hypertension was identical after correcting for eGFR and the effect sizes remained unchanged (unadjusted for eGFR: OR [95%CI] = 0.90[0.83;0.96], p = 0.004; after eGFR adjustment: OR [95%CI] = 0.89[0.83;0.96], p = 0.003) and there was no evidence of heterogeneity across the study samples (Table 3, Figure 4C and 4D).
Fig. 1. Manhattan plot of genomewide –log<sub>10</sub>(p-value) from association analysis of BP extremes in the discovery sample. 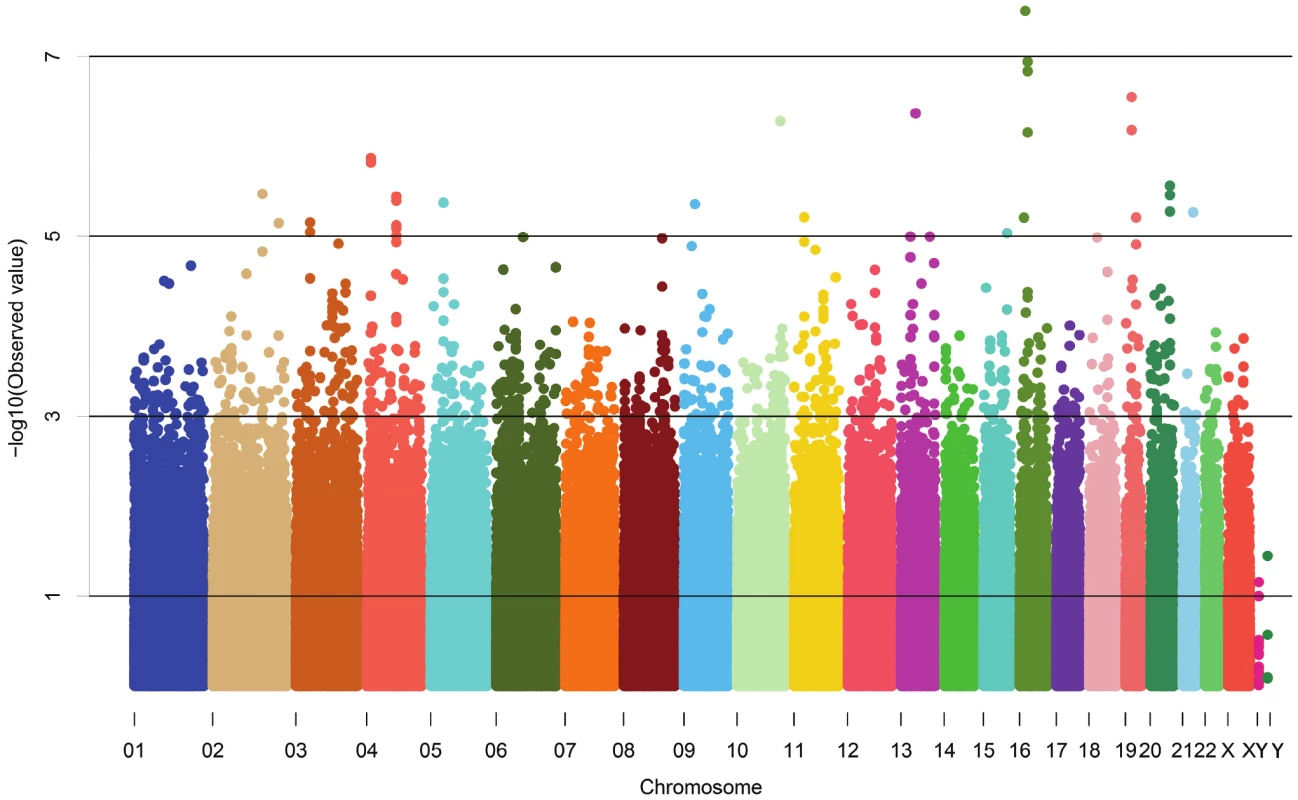
Fig. 2. Quantile-Quantile plot of observed versus expected p-value distributions in the discovery sample. 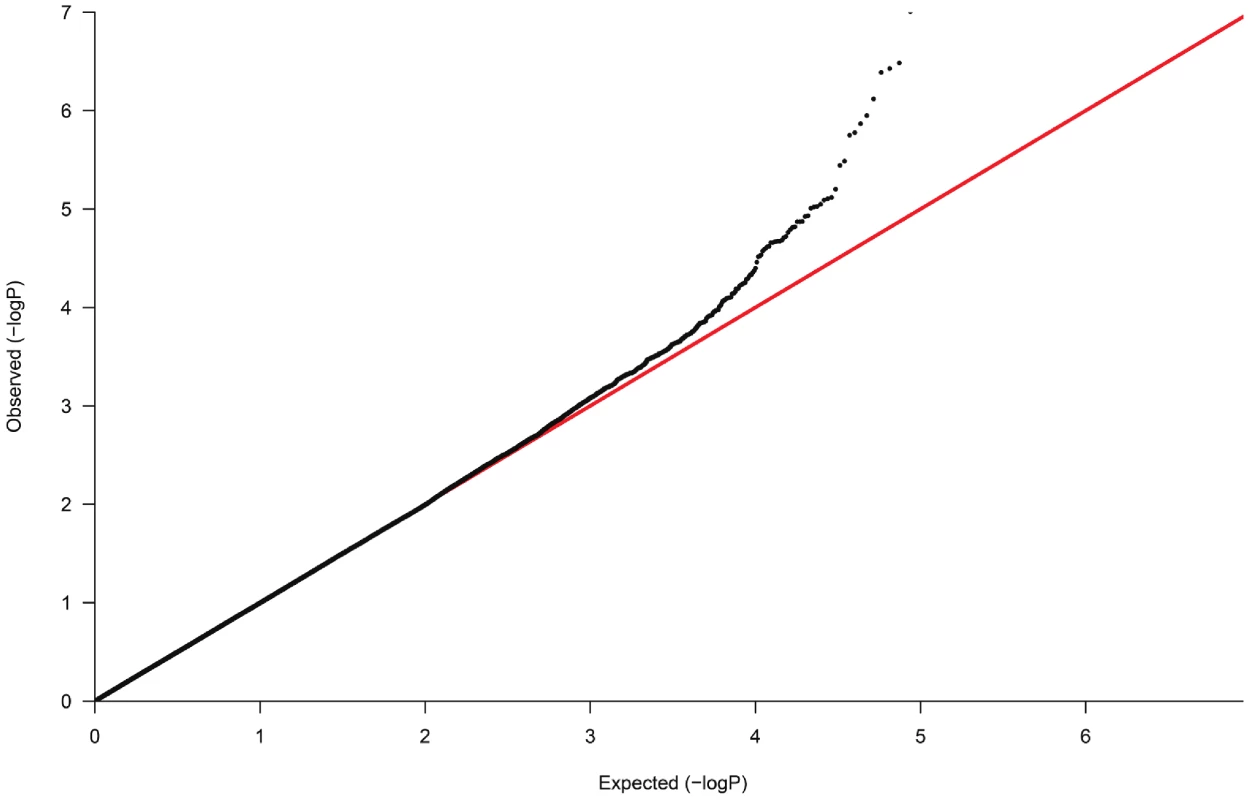
Fig. 3. Association plot of the genomic region around rs13333226 showing both typed and imputed SNPs with location of genes and recombination rate. 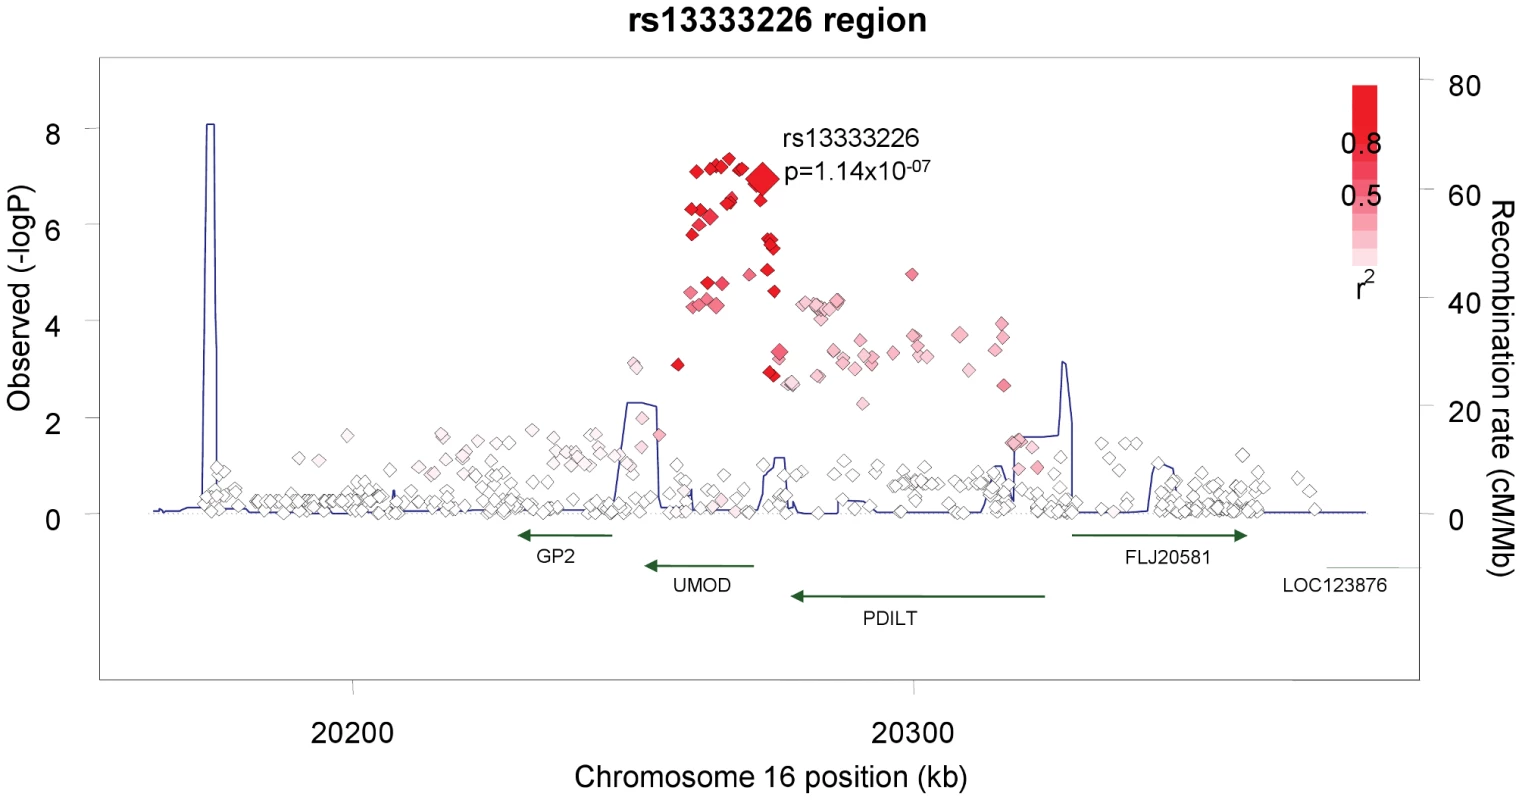
Fig. 4. Forest Plots of association with rs13333226 and hypertension (adjustment for population stratification was applied using principal components as appropriate for each cohort). 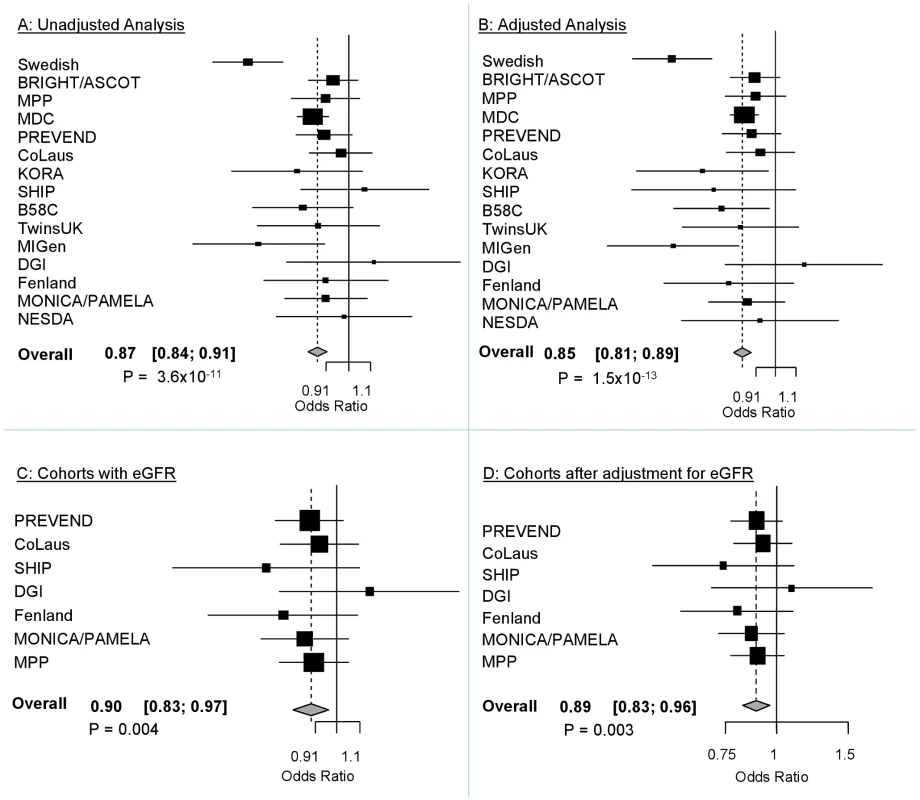
A: Forest plot of association analysis unadjusted for any covariates −21,466 cases and 18,240 controls. B: Forest plot of association analysis adjusted age, age2, sex and BMI −21,466 cases and 18,240 controls. C: Forest plot of association analysis in the cohorts where eGFR was available and adjusted for age, age2, sex, BMI −7427 controls and 5739 cases. D: Forest plot of association analysis in the cohorts where eGFR was available and adjusted for age, age2, sex, BMI and eGFR −7427 controls and 5739 cases. Tab. 1. Demographic characteristics of the discovery case control population. 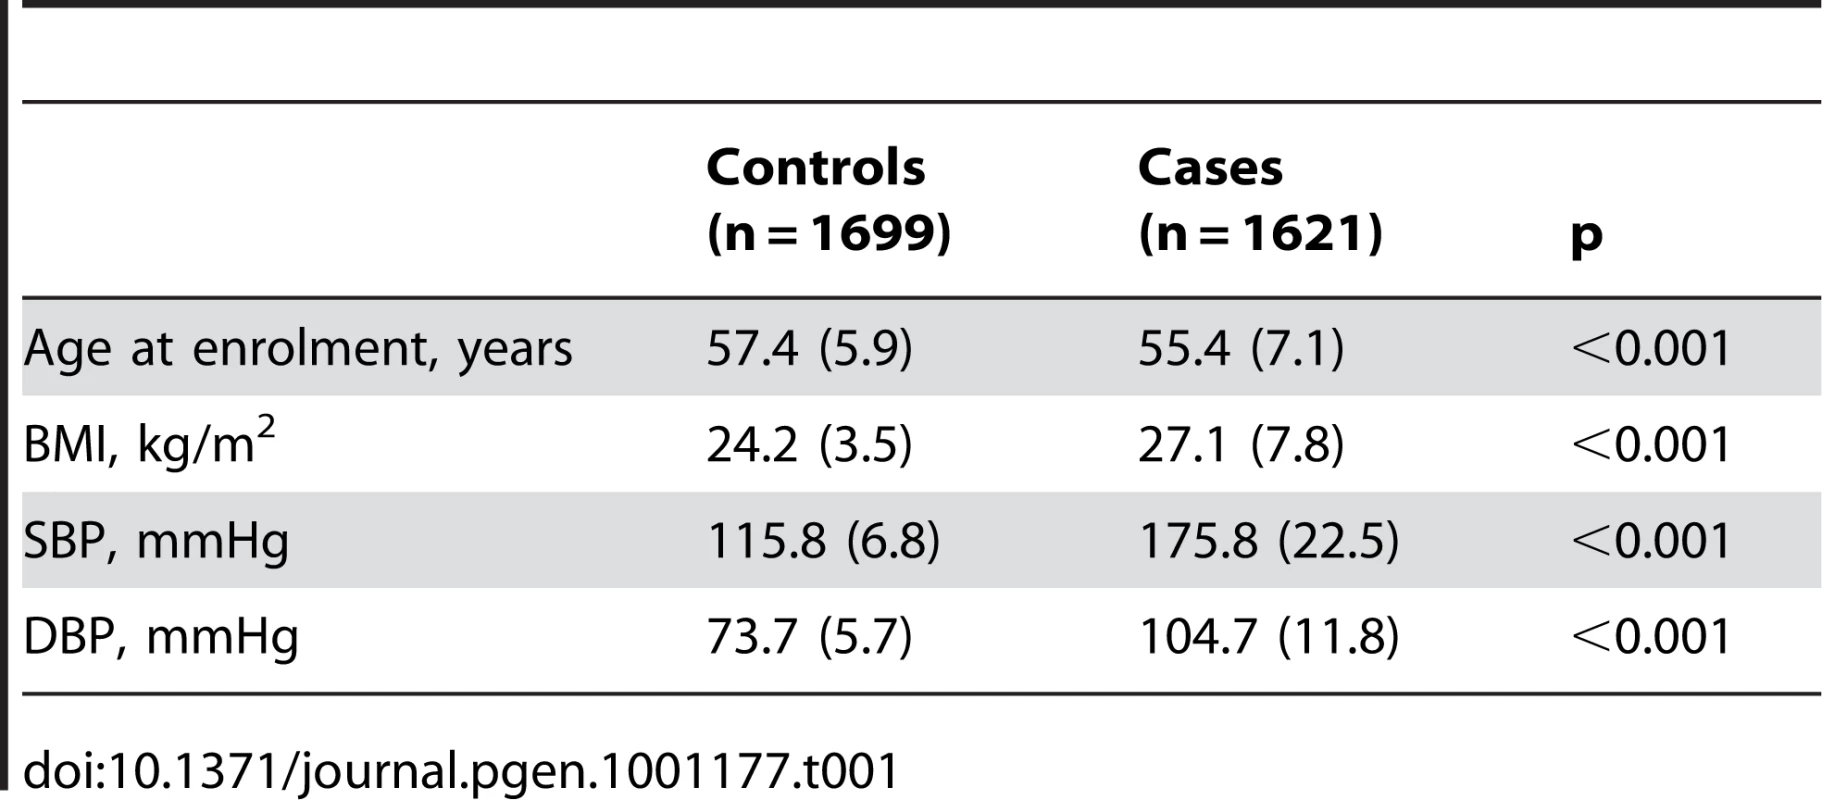
Tab. 2. Results from the meta-analysis of rs13333226 and HTN in discovery sample and after validation. 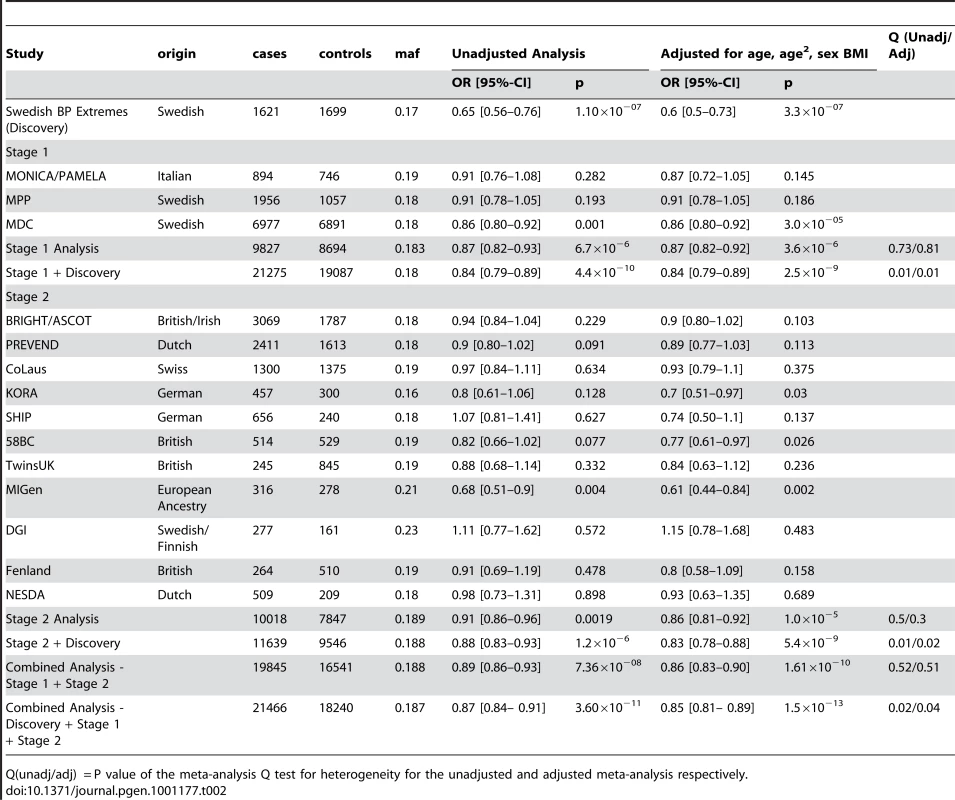
Q(unadj/adj) = P value of the meta-analysis Q test for heterogeneity for the unadjusted and adjusted meta-analysis respectively. Tab. 3. Results from the meta-analysis of rs13333226 and HTN before and after adjustment for eGFR. 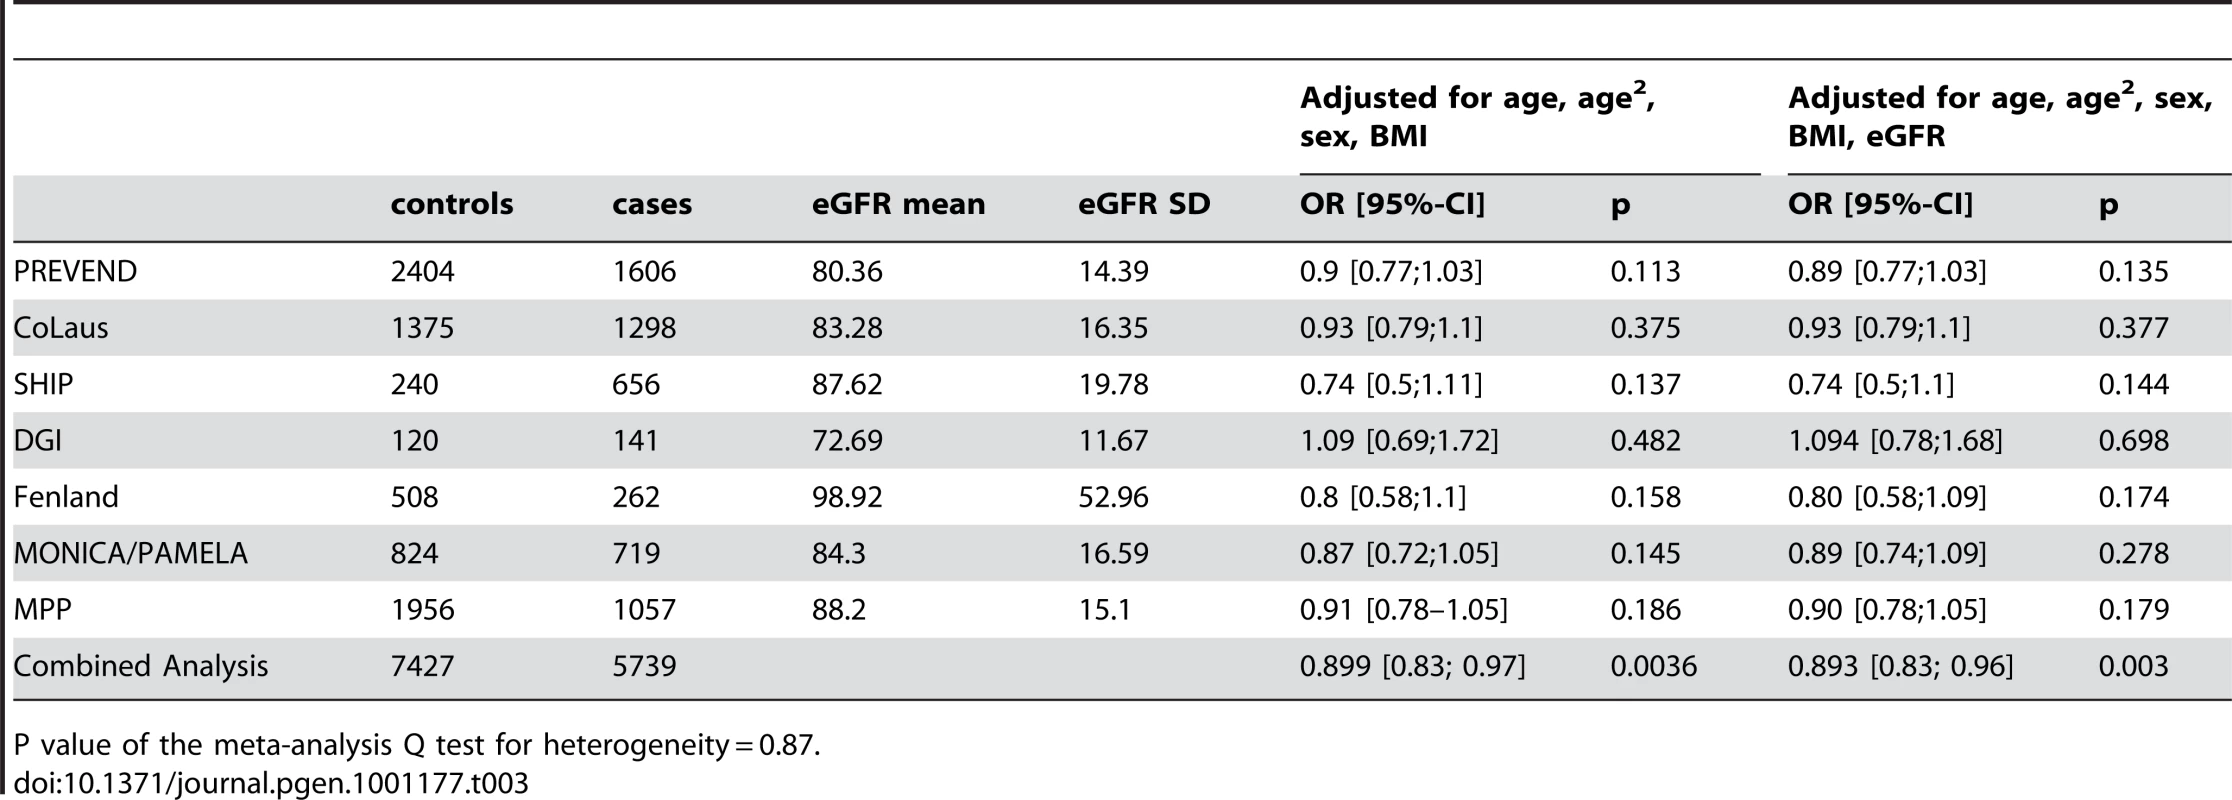
P value of the meta-analysis Q test for heterogeneity = 0.87. Association with SBP and DBP
We examined association of rs13333226 with continuous blood pressure measurements in the entire Global BPgen, MPP and MDC cohorts (n = 79,133). Each copy of the G allele of rs13333226 is associated with 0.49 mmHg lower SBP (p = 2.6×10⁻⁵) and 0.30 mmHg lower DBP ( p = 1.5×10⁻⁵). The direction of continuous trait effect is consistent with the odds of hypertension.
Clinical functional studies
The SNP rs13333226 is in close proximity to the uromodulin transcription start site at −1617 base pairs (Figure 3). We studied the association between rs13333226 genotypes and different phenotypes including urinary uromodulin, in 256 hypertensive individuals from the BRIGHT cohort and 110 participants from the population-based HERCULES study. Univariate analyses showed that the G allele was associated with lower excretion of uromodulin in both the BRIGHT and HERCULES studies (Table 4 and Table 5). Each copy of the G allele was associated with 0.2 mg/mmol lower urinary uromodulin corrected for urine creatinine in BRIGHT study (p = 0.007). Each copy of the G allele was also associated with 4.6 ml/min/1.73 m2 higher eGFR (p = 0.005) in the BRIGHT cohort. In HERCULES, however, a higher creatinine clearance in GG individuals did not attain statistical significance. In both studies the association of rs13333226 with urinary uromodulin levels persisted on multiple regression analysis adjusting for sex, urine sodium and eGFR (p<0.001).
Tab. 4. Univariate association analysis of rs13333226 in 256 hypertensive patients from the BRIGHT study. 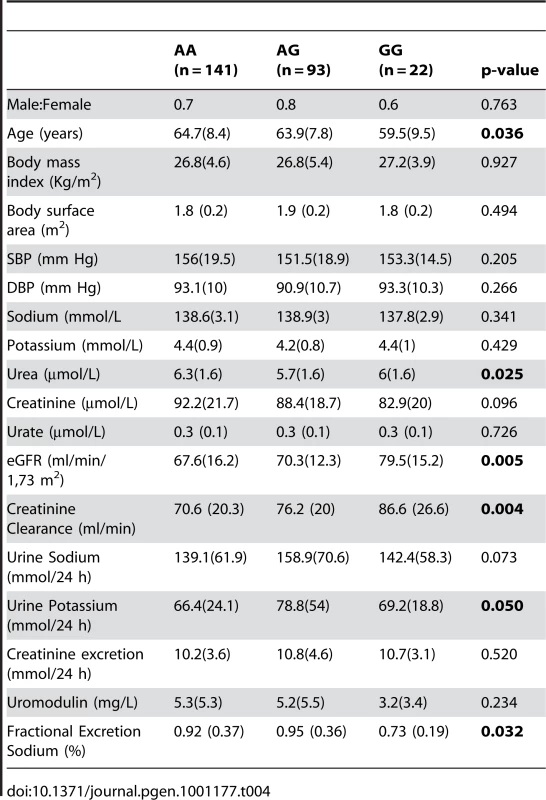
Tab. 5. Univariate association analysis of rs13333226 in 110 participants from the HERCULES Study. 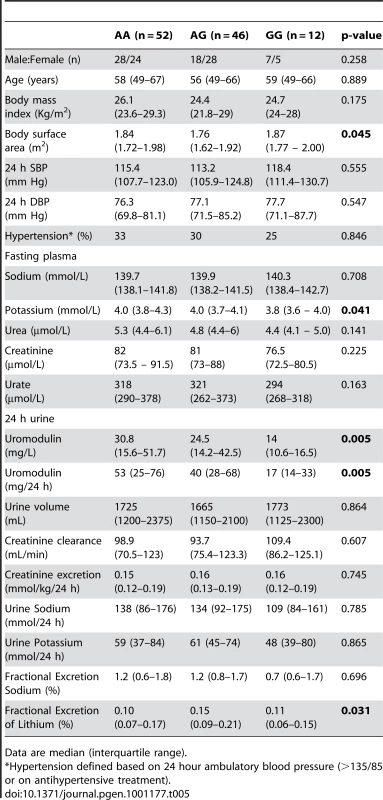
Data are median (interquartile range). In BRIGHT, GG carriers were found to have a significantly lower fractional excretion of sodium (p = 0.032). In the smaller HERCULES sample this also occurred, though short of statistical significance. However, in HERCULES urinary uromodulin was positively associated with urinary sodium excretion (p = 0.025) and fractional excretion of endogenous lithium (r2 = 0.19, p = 0.045). Overall, BRIGHT and HERCULES data suggest that low urinary uromodulin is associated with higher sodium reabsorption, and that this occurs at the proximal tubular level.
In the small GRECO cohort, urinary uromodulin concentration (p = 0.004) and 24 hour uromodulin excretion (p = 0.002; Wilcoxon′s signed ranks test) were found to be significantly increased after a high sodium intake (Table 6). The G allele was associated with lower uromodulin excretion only on low sodium diet (p = 0.002).
Tab. 6. Univariate association analysis of urinary uromodulin in relation to rs13333226 polymorphism and response to high and low sodium intake (GRECO Study). 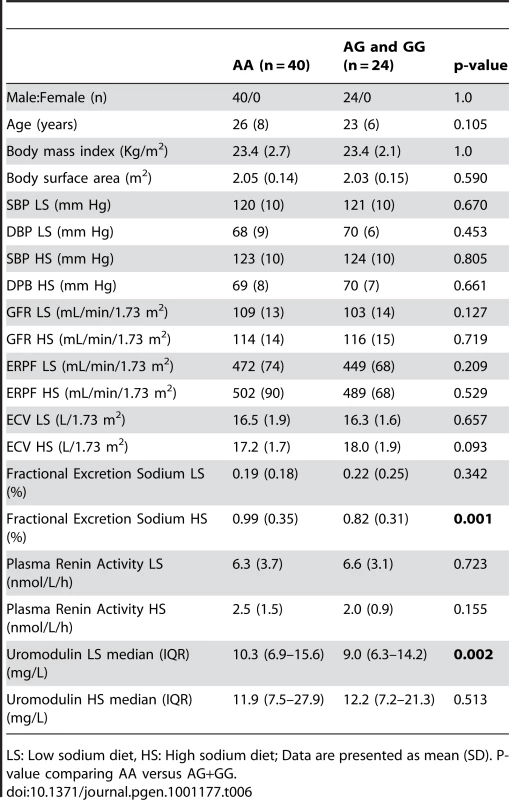
LS: Low sodium diet, HS: High sodium diet; Data are presented as mean (SD). P-value comparing AA versus AG+GG. Cardiovascular outcomes and rs13333226
Finally, we evaluated the clinical significance of our findings by testing whether the low BP associated allele may protect against development of cardiovascular events during long-term follow-up at the population level. Among 26,654 subjects from the entire population based MDC study [11] who were free from prior cardiovascular events at baseline, 2,750 individuals developed cardiovascular events (CVD) during 12 years of follow-up. We found each copy of the G allele to be associated with a 7.7% reduction in risk of CVD events after adjusting for age, sex, BMI and smoking status (H.R. = 0.923, 95% CI 0.860–0.991; p = 0.027). When SBP (H.R. = 0.936, 95% CI 0.872–1.005; p = 0.067) or SBP and DBP (H.R. = 0.937, 95% CI 0.873–1.005; p = 0.069) were added to the Cox regression model, the directionality and risk remained almost identical.
Discussion
We have identified and validated a SNP upstream of the uromodulin (UMOD) gene whose minor allele is associated with a lower risk of hypertension. The associated SNP (rs13333226) is in close proximity to the uromodulin transcription start site at −1617 base pairs. There is only one previous candidate gene study of UMOD and hypertension. This study tested rs6497476, located in the 5′ region of the UMOD gene (−744 bp from UMOD transcriptional start point) and showed the minor allele with a lower risk of hypertension in a Japanese population, but it did not reach statistical significance [12]. This SNP is correlated with rs13333226 in the Japanese HapMap population (r2 = 0.91) and shows the same directionality of effect. A recent genome scan for chronic kidney disease (CKD) [13] has found the minor T allele at rs12917707, −3653 bp upstream from the UMOD transcription start site to be associated with a 20% reduction in risk of CKD. This association was consistent after adjusting for major CKD risk factors including SBP and hypertension. This SNP -rs12917707 is perfectly correlated (r2 = 1 in HapMap CEU) with rs13333226. Our data show the minor allele of rs13333226 is associated with increased eGFR (beta = 3.6, p = 0.012), but adjustment for eGFR in our meta-analyses did not alter its association with lower risk for hypertension. This suggests that the UMOD locus is independently associated with hypertension. We also show an association of rs13333226 with long term cardiovascular outcomes with a relatively small attenuation of the relationship after SBP/DBP adjustment. This suggests UMOD may have an influence on cardiovascular disease at least partly independent of BP. However, our conditional analyses are limited by the fact that single point measures of BP and eGFR may not truly represent the lifetime effect of the genetic variant on these traits. Therefore, we cannot exclude that rs13333226 may exert its effects on hypertension and cardiovascular disease, at least partly through its effects on renal function and blood pressure, respectively.
The UMOD gene encodes the Tamm Horsfall protein (THP)/uromodulin, a glycosylphosphatidylinositol (GPI) anchored glycoprotein. It is the most abundant tubular protein in the urine, which is expressed primarily in the thick ascending limb of the loop of Henle (TAL) with negligible expression elsewhere [14], [15]. We show in the BRIGHT, HERCULES and GRECO (low sodium diet) that the minor allele of rs13333226 (associated with a lower risk of hypertension) is consistently associated with lower urinary uromodulin excretion. This effect was lost when GRECO subjects were given a high sodium diet. We also show in BRIGHT and HERCULES that the G allele and lower urinary uromodulin are associated with lower fractional excretion of sodium and lower fractional excretion of endogenous lithium, indicating increased sodium reabsorption at the proximal tubular level. While the association of lower blood pressure and increased sodium reabsorption may appear counterintuitive, an increased sodium reabsorption by the proximal tubule may simply be the consequence of an increased sodium load because of increased GFR, or a compensatory reaction to a primary decrease in distal reabsorption. In absence of information on sodium intake in individuals in BRIGHT and HERCULES, we cannot exclude that the lower fractional sodium excretion in carriers of the G allele simply reflects a low dietary sodium intake. The exclusive expression of uromodulin in TAL, where physiologically crucial mechanisms of sodium handling are located, suggests that alterations of some of these mechanisms in G allele carriers may underlie their lower risk of hypertension. However, functional studies are needed to clarify the renal mechanisms by which the UMOD gene may affect hypertension and renal sodium handling.
In the context of our findings it is of interest to note that UMOD mutations (in exons 4 and 5) are implicated in monogenic syndromes such as familial juvenile hyperuricemic nephropathy, autosomal-dominant medullary cystic kidney disease [MCKD2] and glomerulocystic kidney disease (GCKD) (MIM603860, MIM162000, MIM609886) [16]–[18]. In previous small studies, urinary uromodulin levels were found to be decreased in older subjects and in subjects with renal impairment [19], [20]. In renal disease patients, uromodulin excretion was reduced in proportion to the extent of renal damage, and was a marker of distal tubular sodium reabsorption, but in these studies, the effects of BP on uromodulin were inconsistent [21], [22]. The TAL, where UMOD is selectively expressed is also the site where mutations of tubular transporters have resulted in rare Mendelian high or low BP syndromes [23]. Furthermore, recent data from Lifton's group demonstrated that heterozygous mutations in SLC12A3 (encoding the thiazide-sensitive Na-Cl cotransporter), SLC12A1 (encoding the Na-K-Cl cotransporter NKCC2), and KCNJ1 (encoding the K+ channel ROMK) discovered in the general population have been associated with lower BP and a 60% reduction in the development of hypertension [24].
Our strategy of using extremes of BP distribution has led to the discovery of a gene variant that could not be discovered when a less stringent case-control definition was used [10]. For example, in stage 1 Global BPgen samples (n = 34,433), the p values for association of rs13333226 with SBP and DBP were 0.0077 and 0.0099 respectively indicating that rs13333226 would not have been selected for validation as the p-value threshold for follow-up genotyping in that study was p<10−5. Also, in Global BPgen study when the top 8 SNPs that attained genome wide significance for continuous BP were tested for association with hypertension, four of the eight SNPs had 0.01<p≤0.10 with odds of hypertension in directions consistent with the continuous trait effect. As effect size of the risk allele of rs13333226 is comparable to the effect sizes of the previous robust association signals for blood pressure[8], [9], we think that using an extreme case-control strategy successfully enabled the discovery of a locus that previous GWAS meta-analysis failed to detect possibly due to the cost imposed by multiple testing correction.
The main limitation of our study is that the functional studies were performed on three different populations – hypertensive, population-based and dietary sodium intervention samples. The renal and blood pressure measurements were measured at single time-points and are not entirely representative of genotype-phenotype effects which occur over prolonged time periods. On the other hand, definitions of the extreme hypertension and extreme normotension in the discovery cohort are based on very robust data. Subjects with extreme hypertension were chosen from an intervention trial in which blood pressure was measured after a wash-out period during which all antihypertensive therapy was discontinued before randomization, whereas normotensive controls were chosen from a population followed up for 10 years and who remained free of cardiovascular disease and antihypertensive treatment throughout this period. Therefore, we think that the newly discovered UMOD locus for hypertension has the potential to give unique insights into the mechanisms of high blood pressure, and identify novel drugable targets.
Methods
Ethical considerations
All studies were approved by institutional ethics review committees at the relevant organizations. All participants provided informed written consent.
Discovery cohort
To identify novel susceptibility loci for hypertension, we used an extreme case-control design. Hypertensive cases had to have at least two consecutive BP measurements of ≥160 mmHg systolic and ≥100 mmHg diastolic, with the diagnosis made before age 63 years. We identified 2,000 cases in the Nordic Diltiazem study (NORDIL) [25]. These hypertensive subjects represent approximately the top 2% of the BP distribution in the Swedish population. Two thousand control subjects were drawn from the Malmö Diet and Cancer study (MDC, n = 27,000) [26] who had a SBP≤ 120 mmHg and DBP≤ 80 mmHg. Controls had to be at least 50 years of age and free from cardiovascular events (coronary events and stroke) during 10 years of follow up [27] and not on any antihypertensive medication. The controls derived from the MDC population represented the lower 9.2% of the BP distribution and with the selection for low cardiovascular risk, can be considered as hyper-controls. In both NORDIL and MDC, BP was measured in the recumbent position after 5–10 minutes rest using a manual sphygmomanometer. Rigorously phenotyped samples minimize case/control misclassification, and the potential advantage of an extreme case/control design is greater power to detect variants associated with BP and hypertension, for a given total sample size and total genotyping cost.
Validation cohorts
For the validation we used phenotypic definitions (extreme SBP/DBP thresholds) to closely match our discovery samples. The BP measurements in all the cohorts were based on the average of at least 2 measurements obtained when the subject was seated and after rest for at least 5 minutes. The BP criteria were slightly modified as most validation cohorts were general population cohorts. Cases: Individuals less than 60 years of age with SBP ≥140 mmHg or DBP ≥90 mmHg or current treatment with antihypertensive or BP lowering medication commenced before age 60 years. Controls: Individuals with SBP ≤120 mmHg and DBP ≤80 mmHg, at least 50 years of age, and free from any BP lowering medication. If age ≤50 years, then the criteria were slightly modified to SBP ≤115 mmHg and DBP ≤80 mmHg and free from BP lowering medications. The validation cohorts were the MONItoring trends and determinants of CArdiovascular diseases (MONICA)/Pressioni Arteriose Monitorate E Loro Associazioni (PAMELA) studies (894 cases/746 controls) from Northern Italy [6], [28], 1956 cases/1057 controls from the 2002–2006 follow-up exam of the Malmö Preventive Project (MPP) [29] and 6977 cases/6891 controls from the Malmö Diet and Cancer study [11] (MDC; non-overlapping with discovery samples), 509 cases/209 controls from The Netherlands Study of Depression and Anxiety study (NESDA) [30] and ten cohorts from a collaboration with the Global BPgen consortium [9]. Analyses reported here are distinct from those previously published [9], because they use phenotypic definitions to match our discovery samples. The combined sample size of the discovery and validation cohorts is 39,706 individuals (21,466 cases and 18,240 controls).
Estimated glomerular filtration rate (eGFR) was calculated using the Modification of Diet in Renal Disease (MDRD) Study equation [31].
Clinical functional studies
We studied functional associations of the top SNP in a hypertensive cohort and a population cohort with extensive urine phenotypes and one interventional study of low and high sodium intake with extensive measurements of sodium balance.
The British Genetics of Hypertension (BRIGHT) study [32] is a hypertension case-control study. Case inclusion criterion was a diagnosis of hypertension (>150/100 mmHg) prior to 50 years of age. Exclusion criteria included BMI>35, diabetes, secondary hypertension or co-existing illness. 24-hour urine collection was available for all the cases with measurements of urinary sodium, potassium, creatinine and microalbuminuria. We measured urinary uromodulin in 256 hypertensive subjects.
Groningen Renal Hemodynamic Cohort Study Group (GRECO): The GRECO protocol comprises integrated measurement of renal hemodynamics and extracellular volume as applied in an ongoing series of studies in healthy subjects [33], [34]. For the current analysis 64 healthy adult males were included (mean age = 23 years), who had been studied after two seven-day periods: the first 7 days on a low sodium diet (LS, 50 mmol Na+ per day, balance verified by repeated 24 h urine), the second 7 days on a high-sodium diet (HS, 200 mmol Na+ per day).
Hypertension Evaluation by Remler and CalciUria LEvel Study (HERCULES) is a substudy of the population-based CoLaus study (www.colaus.ch) from Lausanne Switzerland [35], [36]. A random sample of 411 CoLaus participants, aged 38–78 years, underwent ambulatory BP monitoring and 24 hour urine collection. The phenotypes available include 24-hour urine collection with measurement of creatinine clearance, endogenous lithium clearance, urinary sodium, potassium and uric acid excretion and microalbuminuria. We measured urinary uromodulin in 110 participants of this study.
Urinary uromodulin measurements
Urinary uromodulin was measured in duplicate in 24 hour urine samples using a commercially available ELISA (MD Biosciences, Zürich, Switzerland) as recommended by the manufacturer. The range of assay is 9.375–150 ng/mL and sensitivity <5.50 ng/mL. The inter-assay coefficient of variation was 11.9%. Urinary uromodulin levels were corrected for urine creatinine before analysis.
Genotyping and quality control
The genomewide association study (GWAS) samples were genotyped using Illumina 550K Single and Illumina 610 Quad V1 BeadChip (Illumina, Inc., San Diego, CA, USA). We included 551,629 SNPs common to both the Single and Quad chips, for analysis. SNPs with a minor allele frequency (MAF) <1% or in significant Hardy-Weinberg disequilibrium (P<1×10⁻⁷) in pooled samples were removed leaving 521,220 SNPs for analysis. We assessed population structure within the data using principal components analysis as implemented in EIGENSTRAT [37] to infer continuous axes of genetic variation. After data quality control for unspecified sex (5 subjects removed), relatedness/duplicates (68 individuals removed), multidimensional scaling plot outliers (33 individuals removed), genetic outliers - which are defined as individuals whose ancestry is at least 6 s.d. from the mean on one of the top ten axes of variation on principal component analysis (388 individuals removed) and genotyping success of <95% (92 individuals removed), genotype information from 1,621 cases and 1,699 controls (1,510 males and 1,810 females) was available for analysis. Untyped SNPs were imputed using IMPUTE v1 [38] with data from the August 2009 release of CEU phased haplotypes from Pilot 1 of the 1000 Genomes Project NCBI Build 36 (dbSNP b126) as the reference panel (from https://mathgen.stats.ox.ac.uk/impute/impute_v1.html). The probability threshold used for calling an imputed genotype was 0.9. Association analysis was performed using SNPTEST [38] taking into account uncertainty in imputation.
Statistical analysis
In the GWAS samples, we tested each SNP for association using an additive genetic model and logistic regression with adjustment for significant ancestry principal components [37] to correct for population stratification. There was still a slight overall inflation of test statistics, with a genomic control inflation factor (λ) of 1.07 (Figure 2). All results are presented after application of genomic control to correct for this residual inflation [39]. Additionally two logistic regression analyses were performed, with adjustment for age, age2, sex and BMI and with adjustment for age, age2, sex, BMI and eGFR. Multiple linear regression was used to test association between genotype and urinary uromodulin levels, functional parameters like GFR, extracellular volume etc. with relevant covariates. In the GRECO study, as the numbers of GG genotypes were small, AG and GG were combined for analysis. Non-normally distributed traits were tested using the non-parametric Kruskal Wallis test.
Validation analysis
In validation samples, SNPs were tested for association using logistic regression, with adjustment for ancestry principal components where available to correct for population stratification. Meta-analysis of the combined discovery and validation results was conducted using an inverse-variance weighted (fixed-effects) meta-analysis.
In the meta-analysis, a genomewide significance threshold of 5×10⁻⁸ corresponding to a P value of 0.05 with a Bonferroni correction for 1 million independent tests was considered a priori as genomewide significant [40].
Continuous BP trait modeling
The associations between the validated SNP and SBP and DBP were analysed separately in the Stage 1 samples of the Global BPgen consortium (n = 34,433) and in the overall MDC (n = 27,000) and MPP (n = 17,700) cohorts [9],[26],[29]. The results were combined using fixed-effect inverse variance weighted meta-analysis. Continuous SBP and DBP were adjusted for age, age2, body mass index and any study-specific geographic covariates in sex-specific linear regression models. In individuals taking antihypertensive therapies, blood pressure was imputed by adding 15 mm Hg and 10 mm Hg for SBP and DBP, respectively [9], [41].
Survival analysis
We performed multivariable Cox proportional hazards models to examine the association between biomarkers and incident events. (myocardial infarction, stroke, coronary death). Two models, one adjusted for age, sex, BMI , SBP and smoking status and another adjusting for age, sex, BMI , SBP, DBP and smoking status were analysed. We confirmed that the proportionality of hazards assumption was met. The results are presented as hazard ratios and 95% confidence intervals per copy of the G allele. Survival analysis was performed using SPSS version 13.0 for Windows (SPSS Inc).
Supporting Information
Zdroje
1. EzzatiM
LopezAD
RodgersA
VanderHS
MurrayCJ
2002 Selected major risk factors and global and regional burden of disease. Lancet 360 1347 1360
2. KearneyPM
WheltonM
ReynoldsK
MuntnerP
WheltonPK
2005 Global burden of hypertension: analysis of worldwide data. Lancet 365 217 223
3. LewingtonS
ClarkeR
QizilbashN
PetoR
CollinsR
2002 Age-specific relevance of usual blood pressure to vascular mortality: a meta-analysis of individual data for one million adults in 61 prospective studies. Lancet 360 1903 1913
4. ChobanianAV
BakrisGL
BlackHR
CushmanWC
GreenLA
2003 The Seventh Report of the Joint National Committee on Prevention, Detection, Evaluation, and Treatment of High Blood Pressure: the JNC 7 report. JAMA 289 2560 2572
5. ManciaG
De BackerG
DominiczakA
CifkovaR
FagardR
2007 2007 ESH-ESC Practice Guidelines for the Management of Arterial Hypertension: ESH-ESC Task Force on the Management of Arterial Hypertension. J Hypertens 25 1751 1762
6. SegaR
FacchettiR
BombelliM
CesanaG
CorraoG
2005 Prognostic value of ambulatory and home blood pressures compared with office blood pressure in the general population: follow-up results from the Pressioni Arteriose Monitorate e Loro Associazioni (PAMELA) study. Circulation 111 1777 1783
7. CutlerJA
SorliePD
WolzM
ThomT
FieldsLE
2008 Trends in hypertension prevalence, awareness, treatment, and control rates in United States adults between 1988–1994 and 1999–2004. Hypertension 52 818 827
8. LevyD
EhretGB
RiceK
VerwoertGC
LaunerLJ
2009 Genome-wide association study of blood pressure and hypertension. Nat Genet 41 677 687
9. Newton-ChehC
JohnsonT
GatevaV
TobinMD
BochudM
2009 Genome-wide association study identifies eight loci associated with blood pressure. Nat Genet 41 666 676
10. The Wellcome Trust Case Control Consortium 2007 Genome-wide association study of 14,000 cases of seven common diseases and 3,000 shared controls. Nature 447 661 678
11. SmithJG
PlatonovPG
HedbladB
EngstromG
MelanderO
2010 Atrial fibrillation in the Malmo diet and cancer study: a study of occurrence, risk factors and diagnostic validity. Eur J Epidemiol 25 2 95 102
12. IwaiN
KajimotoK
KokuboY
TomoikeH
2006 Extensive genetic analysis of 10 candidate genes for hypertension in Japanese. Hypertension 48 901 907
13. KottgenA
GlazerNL
DehghanA
HwangSJ
KatzR
2009 Multiple loci associated with indices of renal function and chronic kidney disease. Nat Genet 41 712 717
14. BachmannS
MetzgerR
BunnemannB
1990 Tamm-Horsfall protein-mRNA synthesis is localized to the thick ascending limb of Henle's loop in rat kidney. Histochemistry and Cell Biology 94 517 523
15. MalagoliniN
CavalloneD
Serafini-CessiF
1997 Intracellular transport, cell-surface exposure and release of recombinant Tamm-Horsfall glycoprotein. Kidney Int 52 1340 1350
16. HartTC
GorryMC
HartPS
WoodardAS
ShihabiZ
2002 Mutations of the UMOD gene are responsible for medullary cystic kidney disease 2 and familial juvenile hyperuricaemic nephropathy. J Med Genet 39 882 892
17. RampoldiL
CaridiG
SantonD
BoarettoF
BernasconeI
2003 Allelism of MCKD, FJHN and GCKD caused by impairment of uromodulin export dynamics. Hum Mol Genet 12 3369 3384
18. Vylet'alP
KublovaM
KalbacovaM
HodanovaK
BaresovaV
2006 Alterations of uromodulin biology: a common denominator of the genetically heterogeneous FJHN/MCKD syndrome. Kidney Int 70 1155 1169
19. TorffvitO
JorgensenPE
KamperAL
Holstein-RathlouNH
LeyssacPP
1998 Urinary excretion of Tamm-Horsfall protein and epidermal growth factor in chronic nephropathy. Nephron 79 167 172
20. ZurbigP
DecramerS
DaknaM
JantosJ
GoodDM
2009 The human urinary proteome reveals high similarity between kidney aging and chronic kidney disease. Proteomics 9 2108 2117
21. DulawaJ
KokotF
KokotM
PanderH
1998 Urinary excretion of Tamm-Horsfall protein in normotensive and hypertensive elderly patients. J Hum Hypertens 12 635 637
22. TorffvitO
AgardhCD
ThulinT
1999 A study of Tamm-Horsfall protein excretion in hypertensive patients and type 1 diabetic patients. Scand J Urol Nephrol 33 187 191
23. LiftonRP
2004 Genetic dissection of human blood pressure variation: common pathways from rare phenotypes. Harvey Lect 100 71 101
24. JiW
FooJN
O'RoakBJ
ZhaoH
LarsonMG
2008 Rare independent mutations in renal salt handling genes contribute to blood pressure variation. Nat Genet 40 592 599
25. HanssonL
HednerT
Lund-JohansenP
KjeldsenSE
LindholmLH
2000 Randomised trial of effects of calcium antagonists compared with diuretics and beta-blockers on cardiovascular morbidity and mortality in hypertension: the Nordic Diltiazem (NORDIL) study. Lancet 356 359 365
26. BerglundG
ElmstahlS
JanzonL
LarssonSA
1993 The Malmo Diet and Cancer Study. Design and feasibility. J Intern Med 233 45 51
27. KathiresanS
MelanderO
AnevskiD
GuiducciC
BurttNP
2008 Polymorphisms associated with cholesterol and risk of cardiovascular events. N Engl J Med 358 1240 1249
28. FerrarioM
SegaR
CesanaGC
1991 Lessons from the MONICA Study in Northern Italy. J Hypertens 9 S7 S14
29. LyssenkoV
JonssonA
AlmgrenP
PulizziN
IsomaaB
2008 Clinical risk factors, DNA variants, and the development of type 2 diabetes. N Engl J Med 359 2220 2232
30. LichtCM
de GeusEJ
SeldenrijkA
van HoutHP
ZitmanFG
2009 Depression is associated with decreased blood pressure, but antidepressant use increases the risk for hypertension. Hypertension 53 631 638
31. LeveyAS
BoschJP
LewisJB
GreeneT
RogersN
1999 A more accurate method to estimate glomerular filtration rate from serum creatinine: a new prediction equation. Modification of Diet in Renal Disease Study Group. Ann Intern Med 130 461 470
32. CaulfieldM
MunroeP
PembrokeJ
SamaniN
DominiczakA
2003 Genome-wide mapping of human loci for essential hypertension. Lancet 361 2118 2123
33. VisserFW
MuntingaJH
DierckxRA
NavisG
2008 Feasibility and impact of the measurement of extracellular fluid volume simultaneous with GFR by 125I-iothalamate. Clin J Am Soc Nephrol 3 1308 1315
34. VisserFW
BoonstraAH
TitiaLA
BoomsmaF
NavisG
2008 Renal response to angiotensin II is blunted in sodium-sensitive normotensive men. Am J Hypertens 21 323 328
35. BochudM
BovetP
VollenweiderP
MaillardM
PaccaudF
2009 Association between white-coat effect and blunted dipping of nocturnal blood pressure. Am J Hypertens 22 1054 1061
36. BochudM
StaessenJA
MaillardM
MazekoMJ
KuznetsovaT
2009 Ethnic differences in proximal and distal tubular sodium reabsorption are heritable in black and white populations. J Hypertens 27 606 612
37. PriceAL
PattersonNJ
PlengeRM
WeinblattME
ShadickNA
2006 Principal components analysis corrects for stratification in genome-wide association studies. Nat Genet 38 904 909
38. MarchiniJ
HowieB
MyersS
McVeanG
DonnellyP
2007 A new multipoint method for genome-wide association studies by imputation of genotypes. Nat Genet 39 906 913
39. DevlinB
RoederK
1999 Genomic control for association studies. Biometrics 55 997 1004
40. McCarthyMI
AbecasisGR
CardonLR
GoldsteinDB
LittleJ
2008 Genome-wide association studies for complex traits: consensus, uncertainty and challenges. Nat Rev Genet 9 356 369
41. TobinMD
SheehanNA
ScurrahKJ
BurtonPR
2005 Adjusting for treatment effects in studies of quantitative traits: antihypertensive therapy and systolic blood pressure. Stat Med 24 2911 2935
Štítky
Genetika Reprodukčná medicína
Článok vyšiel v časopisePLOS Genetics
Najčítanejšie tento týždeň
2010 Číslo 10- Gynekologové a odborníci na reprodukční medicínu se sejdou na prvním virtuálním summitu
- Je „freeze-all“ pro všechny? Odborníci na fertilitu diskutovali na virtuálním summitu
-
Všetky články tohto čísla
- Common Genetic Variants and Modification of Penetrance of -Associated Breast Cancer
- FSHD: A Repeat Contraction Disease Finally Ready to Expand (Our Understanding of Its Pathogenesis)
- Genome-Wide Identification of Targets and Function of Individual MicroRNAs in Mouse Embryonic Stem Cells
- Allele-Specific Down-Regulation of Expression Induced by Retinoids Contributes to Climate Adaptations
- The Meiotic Recombination Checkpoint Suppresses NHK-1 Kinase to Prevent Reorganisation of the Oocyte Nucleus in
- Actin Depolymerizing Factors Cofilin1 and Destrin Are Required for Ureteric Bud Branching Morphogenesis
- DSIF and RNA Polymerase II CTD Phosphorylation Coordinate the Recruitment of Rpd3S to Actively Transcribed Genes
- Continuous Requirement for the Clr4 Complex But Not RNAi for Centromeric Heterochromatin Assembly in Fission Yeast Harboring a Disrupted RITS Complex
- Genome-Wide Association Study of Blood Pressure Extremes Identifies Variant near Associated with Hypertension
- The Cytosine Methyltransferase DRM2 Requires Intact UBA Domains and a Catalytically Mutated Paralog DRM3 during RNA–Directed DNA Methylation in
- β-Actin and γ-Actin Are Each Dispensable for Auditory Hair Cell Development But Required for Stereocilia Maintenance
- Genetic Association Study Identifies as a Risk Gene for Idiopathic Dilated Cardiomyopathy
- Evidence for a Xer/ System for Chromosome Resolution in Archaea
- Four Novel Loci (19q13, 6q24, 12q24, and 5q14) Influence the Microcirculation
- Lifespan Extension by Preserving Proliferative Homeostasis in
- Ancient and Recent Adaptive Evolution of Primate Non-Homologous End Joining Genes
- Loss of the p53/p63 Regulated Desmosomal Protein Perp Promotes Tumorigenesis
- Altering a Histone H3K4 Methylation Pathway in Glomerular Podocytes Promotes a Chronic Disease Phenotype
- Characterization of LINE-1 Ribonucleoprotein Particles
- Conserved Genes Act as Modifiers of Invertebrate SMN Loss of Function Defects
- Alternative Splicing at a NAGNAG Acceptor Site as a Novel Phenotype Modifier
- Tight Regulation of the Gene of the KplE1 Prophage: A New Paradigm for Integrase Gene Regulation
- Conjugative DNA Transfer Induces the Bacterial SOS Response and Promotes Antibiotic Resistance Development through Integron Activation
- Nasty Viruses, Costly Plasmids, Population Dynamics, and the Conditions for Establishing and Maintaining CRISPR-Mediated Adaptive Immunity in Bacteria
- Stress-Induced Activation of Heterochromatic Transcription
- H3K27me3 Profiling of the Endosperm Implies Exclusion of Polycomb Group Protein Targeting by DNA Methylation
- Simultaneous Disruption of Two DNA Polymerases, Polη and Polζ, in Avian DT40 Cells Unmasks the Role of Polη in Cellular Response to Various DNA Lesions
- Characterising and Predicting Haploinsufficiency in the Human Genome
- Dual Functions of ASCIZ in the DNA Base Damage Response and Pulmonary Organogenesis
- Pervasive Cryptic Epistasis in Molecular Evolution
- Transition from Positive to Neutral in Mutation Fixation along with Continuing Rising Fitness in Thermal Adaptive Evolution
- Comprehensive Analysis Reveals Dynamic and Evolutionary Plasticity of Rab GTPases and Membrane Traffic in
- Regulates Tissue-Specific Mitochondrial DNA Segregation
- Role for the Mammalian Swi5-Sfr1 Complex in DNA Strand Break Repair through Homologous Recombination
- PLOS Genetics
- Archív čísel
- Aktuálne číslo
- Informácie o časopise
Najčítanejšie v tomto čísle- Genome-Wide Identification of Targets and Function of Individual MicroRNAs in Mouse Embryonic Stem Cells
- Common Genetic Variants and Modification of Penetrance of -Associated Breast Cancer
- Allele-Specific Down-Regulation of Expression Induced by Retinoids Contributes to Climate Adaptations
- Simultaneous Disruption of Two DNA Polymerases, Polη and Polζ, in Avian DT40 Cells Unmasks the Role of Polη in Cellular Response to Various DNA Lesions
Prihlásenie#ADS_BOTTOM_SCRIPTS#Zabudnuté hesloZadajte e-mailovú adresu, s ktorou ste vytvárali účet. Budú Vám na ňu zasielané informácie k nastaveniu nového hesla.
- Časopisy


