-
Články
- Časopisy
- Kurzy
- Témy
- Kongresy
- Videa
- Podcasty
Genome-Wide Association Study for Serum Complement C3 and C4 Levels in Healthy Chinese Subjects
Complement C3 and C4 play key roles in the main physiological activities of complement system, and their deficiencies or over-expression are associated with many clinical infectious or immunity diseases. A two-stage genome-wide association study (GWAS) was performed for serum levels of C3 and C4. The first stage was conducted in 1,999 healthy Chinese men, and the second stage was performed in an additional 1,496 subjects. We identified two SNPs, rs3753394 in CFH gene and rs3745567 in C3 gene, that are significantly associated with serum C3 levels at a genome-wide significance level (P = 7.33×10⁻¹¹ and P = 1.83×10⁻⁹, respectively). For C4, one large genomic region on chromosome 6p21.3 is significantly associated with serum C4 levels. Two SNPs (rs1052693 and rs11575839) were located in the MHC class I area that include HLA-A, HLA-C, and HLA-B genes. Two SNPs (rs2075799 and rs2857009) were located 5′ and 3′ of C4 gene. The other four SNPs, rs2071278, rs3763317, rs9276606, and rs241428, were located in the MHC class II region that includes HLA-DRA, HLA-DRB, and HLA-DQB genes. The combined P-values for those eight SNPs ranged from 3.19×10⁻²² to 5.62×10−97. HBsAg-positive subjects have significantly lower C3 and C4 protein concentrations compared with HBsAg-negative subjects (P<0.05). Our study is the first GWAS report which shows genetic components influence the levels of complement C3 and C4. Our significant findings provide novel insights of their related autoimmune, infectious diseases, and molecular mechanisms.
Published in the journal: Genome-Wide Association Study for Serum Complement C3 and C4 Levels in Healthy Chinese Subjects. PLoS Genet 8(9): e32767. doi:10.1371/journal.pgen.1002916
Category: Research Article
doi: https://doi.org/10.1371/journal.pgen.1002916Summary
Complement C3 and C4 play key roles in the main physiological activities of complement system, and their deficiencies or over-expression are associated with many clinical infectious or immunity diseases. A two-stage genome-wide association study (GWAS) was performed for serum levels of C3 and C4. The first stage was conducted in 1,999 healthy Chinese men, and the second stage was performed in an additional 1,496 subjects. We identified two SNPs, rs3753394 in CFH gene and rs3745567 in C3 gene, that are significantly associated with serum C3 levels at a genome-wide significance level (P = 7.33×10⁻¹¹ and P = 1.83×10⁻⁹, respectively). For C4, one large genomic region on chromosome 6p21.3 is significantly associated with serum C4 levels. Two SNPs (rs1052693 and rs11575839) were located in the MHC class I area that include HLA-A, HLA-C, and HLA-B genes. Two SNPs (rs2075799 and rs2857009) were located 5′ and 3′ of C4 gene. The other four SNPs, rs2071278, rs3763317, rs9276606, and rs241428, were located in the MHC class II region that includes HLA-DRA, HLA-DRB, and HLA-DQB genes. The combined P-values for those eight SNPs ranged from 3.19×10⁻²² to 5.62×10−97. HBsAg-positive subjects have significantly lower C3 and C4 protein concentrations compared with HBsAg-negative subjects (P<0.05). Our study is the first GWAS report which shows genetic components influence the levels of complement C3 and C4. Our significant findings provide novel insights of their related autoimmune, infectious diseases, and molecular mechanisms.
Introduction
The complement has been recognized as one pivotal part of innate and adaptive immune system, and it had three well-known physiologic activities, including host defense against infection, bridging interface between innate and adaptive immunity, and disposal of waste immune complexes or apoptotic cells [1], [2]. There are approximately 30 serum complement proteins, which can be activated by classical, alternative, and lectin pathways [3]. Among these complement members, C3 and C4 are almost involved in all physiological activities and activated pathways, and exert their powerful roles as host defense proteins [4]. Their abnormal expression, especially, complement deficiency and dysfunction, is associated with the pathogenesis of numerous inflammatory and autoimmune disorder diseases, such as systemic lupus erythematosus (SLE), rheumatoid arthritis, asthma [1], [5]. C4 deficiency also has been reported to be associated with SLE, immune complex glomerulonephritis, virus infection, regardless of ethnicity background [6], [7], [8].
Both Serum C3 and C4 levels are heritable traits even in individuals without immune diseases such as SLE. Recent reports also showed that the heritability for serum C3 and C4 were 39.6% and 45.4%, respectively, based on Bayesian variance components model [9], [10]. Therefore, it is important to identify the genetic loci which influence the serum levels of C3 and C4. In this study, we carried out a two-stage Genome-Wide Association Study (GWAS) to identify novel loci that are associated with the serum levels of C3 and C4 in a healthy Chinese male population of 3,495 subjects.
Methods
Study samples
A total of 2,012 men from the Fangchenggang Area Male Health and Examination Survey (FAMHES) participated in the stage 1 of GWAS study as healthy volunteers. The FAMHES project was conducted in Fangchenggang city, Guangxi, southern China in 2009. A total of 4,303 Chinese men ranged from age 17 to 88 years-old were recruited [11]. The subjects used in our stage 1 were limited to age 20 to 69 years-old, and were all self-reported southern Chinese Han ethnicity. The replication subjects in the stage 2 included 1,496 men age 20 to 70 years-old, who were recruited in conjunction with health examinations that were performed at three collaborating hospitals in Guangxi, China.
Written informed consents to participate in the present study were obtained from all of the subjects. Standardized health questionnaires were then used through a face-to-face interview conducted by trained physicians. Collected data included demographic, lifestyle characteristics (smoking, alcohol consumption), health status, family history, and medical histories. The subjects who self-reported with diabetes mellitus, coronary heart disease, stroke, hyperthyroidism, rheumatoid arthritis, and tumors were excluded from the study population. The detected samples with abnormal liver function (ALT) were also excluded. The study was approved by the Ethics and Human Subject Committee of Guangxi Medical University.
Measurement of complement C3 and C4
Overnight fasting venous blood specimens were drawn between 7 : 00 and 10 : 00 am, and serum samples were extracted and stored at −80°C, until required for detection in the laboratory. Both serum C3 and C4 were measured with Immunoturbidimetric methods on the HITACHI 7600 biochemistry analyzer (Hitachi Corp, Tokyo, Japan), using complement C3 and C4 assay kits (Zhicheng Bio Company, Shanghai, China), and their inter-assay coefficients of variation were 2.1% and 2.5%, respectively.
SNP genotyping
Two different platforms were used for SNP genotyping. The Illumina Omini one platform was used for the genome-wide assay of samples in stage 1. For SNPs that were followed in the 2nd stage, the iPLEX of Sequenom platform was used for genotyping (Sequenom, Inc., San Diego, CA). Polymerase chain reaction (PCR) and extension primers were designed using MassARRAY Assay Design 3.1 software (Sequenom, Inc., San Diego, CA). Genotyping procedures were performed according to the manufacturer's iPLEX Application Guide (Sequenom Inc. SanDiego, CA). All genotyping reactions were performed in 384-well plates. Each plate included a duplicate for three or four subjects selected at random, as well as six to nine negative controls in which water was substituted for DNA. The average concordance rate was 99.8%.
CNV analysis for C4 gene
To evaluate the C4 copy number variations (CNV), quantitative PCR (qPCR) was performed using SYBR green chemistry on the 100 randomly selected subjects from Stage 1 population. Three pairs of specific primers were designed at the front, middle rear position of C4 gene. Two pairs of internal primers based on RPP14 and ALB genes were selected to normalize the nonspecific error. Relative gene dosage determination was carried out using an ABI 7900 Real time PCR System. Total 12 µl PCR reaction mixture contained 3 µl free water, 6 µl 2×SYBR (ABI, Part no. 4304886), 1.8 µl primers, and 1.2 µl genomic DNA template. The delta-delta Ct method was used to calculate the copy numbers of C4 gene. The average C4 copy number was set at 4 based on previous reports.
Statistical analysis
Quality Control (QC) procedures were first applied to 2,012 individuals that were genotyped using the Illumina Omni one platform. A total of 1,999 individuals passed the call rate of 95% and were used in the final statistical analysis. We then applied the following QC criteria to filter SNPs: P<0.001 for the Hardy-Weinberg Equilibrium (HWE) test, minor allele frequency (MAF) <0.01, and genotype call rate <95%. A total of 709,211 SNPs remained in the final analysis. The IMPUTE computer program was then used to infer the genotypes of SNPs (e.g. SNPs catalogued in Hapmap Phase II CHB population release #24) in the genome that were not directly genotyped [12]. A posterior probability of >0.90 was applied to call genotypes that were imputed from IMPUTE software. A total of 1,940,245 SNPs remained in our final analysis after applying the same QC criteria, as mentioned above.
Serum C4 levels were logarithmic transformed to normalize the distribution. The associations of the SNPs with serum C3 and C4 levels were evaluated using a linear regression model assuming additive effects of the alleles (0, 1 and 2). In the regression models, the age, logBMI were adjusted as covariates for both C3 and C4, and smoking also adjusted for C3.The PLINK software package was used to perform this statistical analysis [13]. The EIGENSTRAT software was applied for the evaluation of population stratification by a principal component approach [14]. The top two eigenvectors were adjusted as covariates in the linear regression analysis. Quantile-Quantile plots were generated using R package. For regions with multiple SNPs that were significant at a genome-wide significant level of 5×10⁻⁸, a stepwise (forwards - backwards) regression modeling was performed to select the independent SNPs to be confirmed in the 2nd stage. Firstly, the most significant SNP within each of the associated region with C3 (1q21.3 and 19p13) and C4 (MHC region in 6p21.3) was entered into the linear regression model. Secondly, the step-wise procedure iteratively added SNPs (forwards) that reach genome-wide significant level in the single SNP analysis (with adjustment of covariates). A SNP remains in the model if goodness-of-fit (the Arkaike Information Criterion (AIC) metric) improves. A SNP that is already in the model can also be removed if the AIC improves by doing so. The stepwise procedure was performed by SAS 9.2 (Cary, NC). The combined analysis of two-stage data was performed using a linear regression, adjusting for the covariates and stage information. ANOVA analysis was used to evaluate the difference of serum C4 levels among the varied C4 gene dose groups.
Results
General subjects characters
The first stage was composed of 1999 healthy Chinese men, and the second stage with 1496 male subjects. No significant difference was found between samples of the first and the second stage (Table 1) regarding to the mean age, smoking distribution and mean body mass index, P>0.05, respectively. The frequency distribution of C3 and C4 levels among the stage 1 healthy population were shown in the Figure S1. An analysis of the correlation between serum levels of C3 and C4 revealed a significantly positive relationship (r = 0.521, P<0.01).
Tab. 1. General characteristic of the two-stage GWAS study subjects. 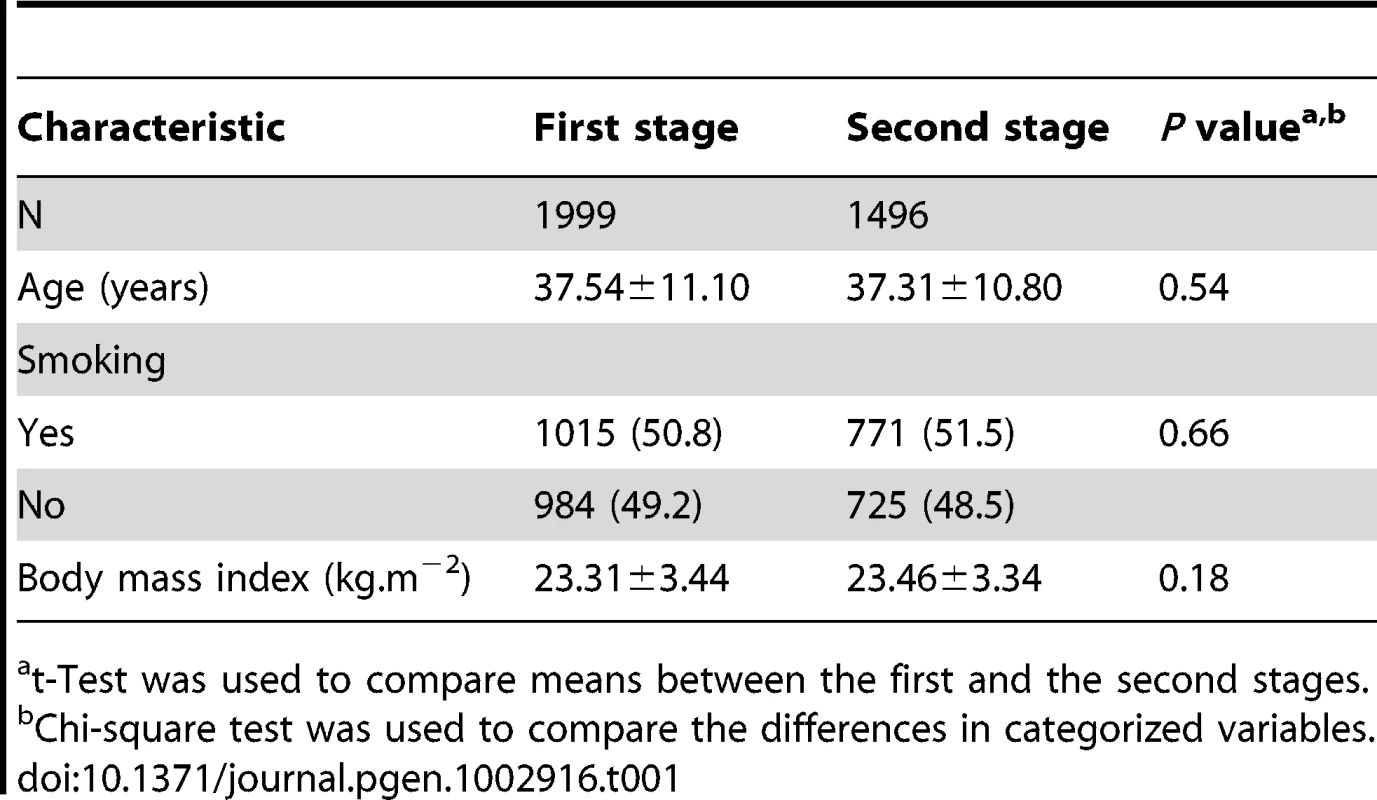
t-Test was used to compare means between the first and the second stages. In stage 1, limited population stratification was observed (Figure S2). In addition, we did not observe any evidence for the systematic bias of the association for either C3 or C4 phenotype, as indicated by the Quantile-Quantile (Q-Q) plots (Figure S3). The inflation factor was estimated to be 1.046 and 1.054 for C3 and C4, respectively.
GWAS for serum C3 levels
For C3 level, there are two genomic loci that were significant at a P-value cutoff of 5×10⁻⁸, including one loci on 1q31.3 and one loci on chromosome 19p13.3, respectively (Figure 1 and Figure S4). For the region on 1q31.3, a total of four SNPs reached a P-value cutoff of 10−8. Rs3753394 was the only SNP that remained in the stepwise model selection procedure. Therefore, only rs3753394 was selected to be followed up in stage 2. For the region on chr19p13.3, the only SNP (rs3745567) that reached a P-value of 5×10⁻⁸ was followed in stage 2. In stage 2, both rs3753394 and rs3745567 were confirmed to be significantly associated with C3 levels at a P cut-off of 0.025 (Bonferroni correction of 2 tests) (P = 1.08×10⁻³ and P = 3.58×10⁻⁴, respectively). The combined analysis of stage 1 and stage 2 data revealed highly significant association with C3 level for rs3753394 and rs374567 (P = 7.33×10⁻¹¹ and P = 1.83×10⁻⁹, respectively) (Table 2). The estimated decrease for C3 level for rs3753394 was 0.05 g/l for each additional T allele (SE = 0.01). For rs3745567, the estimated increase for C3 level was 0.08 g/l for each additional T allele (SE = 0.02). In addition, the proportion of variability in the C3 level explained by the two SNPs was 59.0% (R2 = 0.59) in our multivariate linear regression model.
Fig. 1. Manhattan plot of genome-wide association analyses for C3 level. 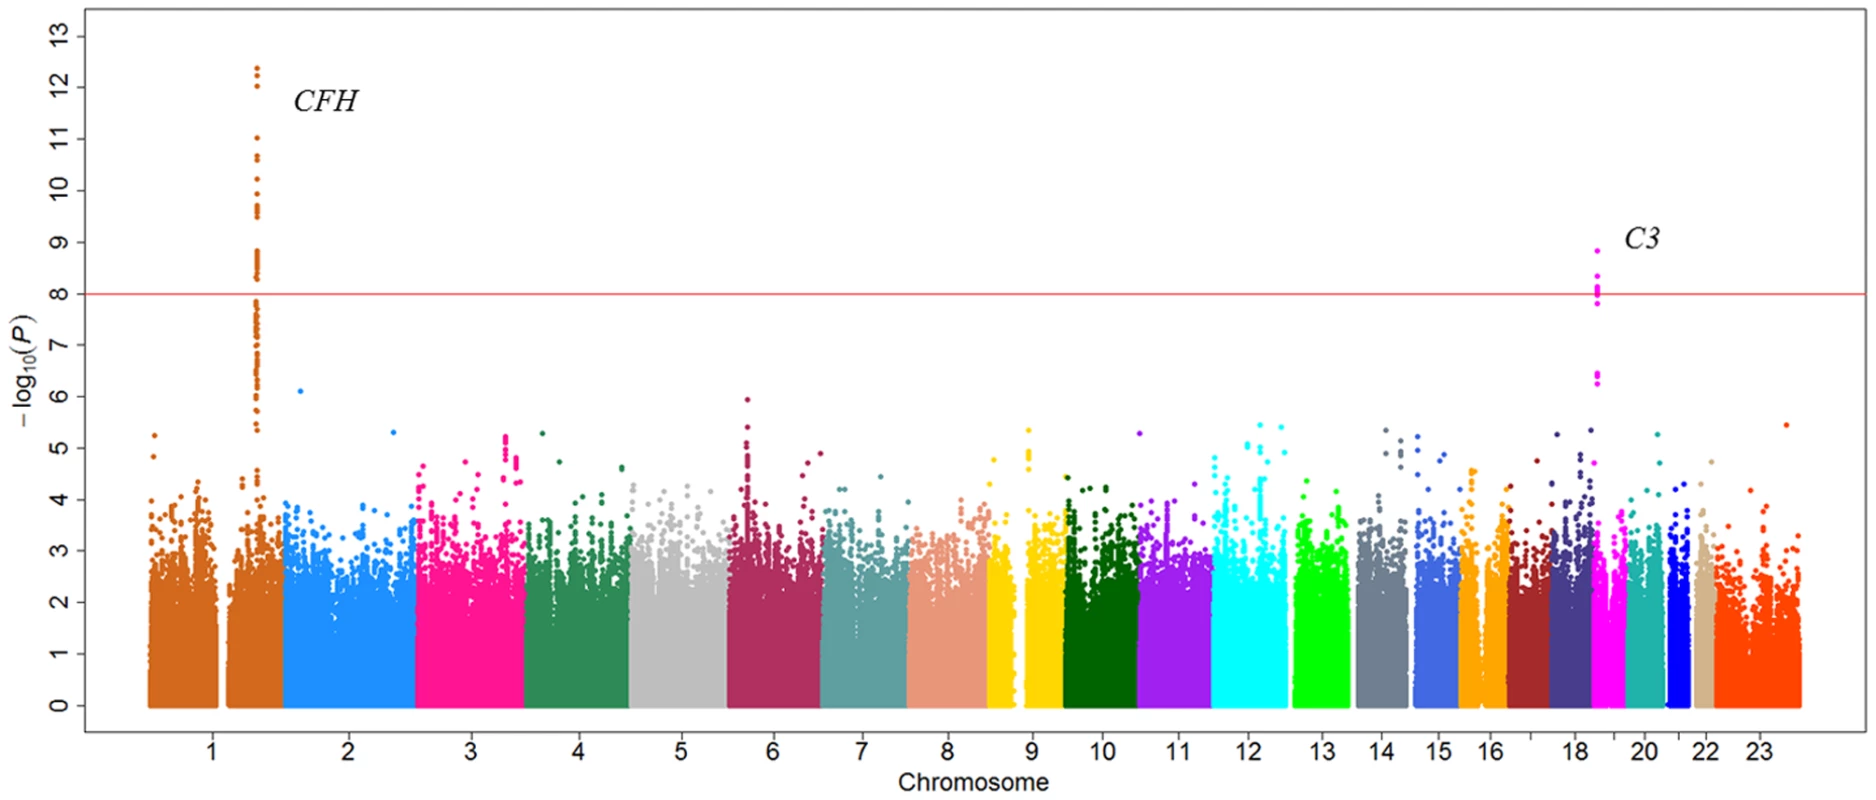
X-axis shows chromosomal positions. Y-axis shows –log10 P-values from linear regression adjusted for age, smoking, and logBMI. The horizontal solid line indicates the preset threshold of P = 5×10⁻⁸. Tab. 2. SNPs associated with C3 and C4 levels from two-stage GWAS study in Chinese population. 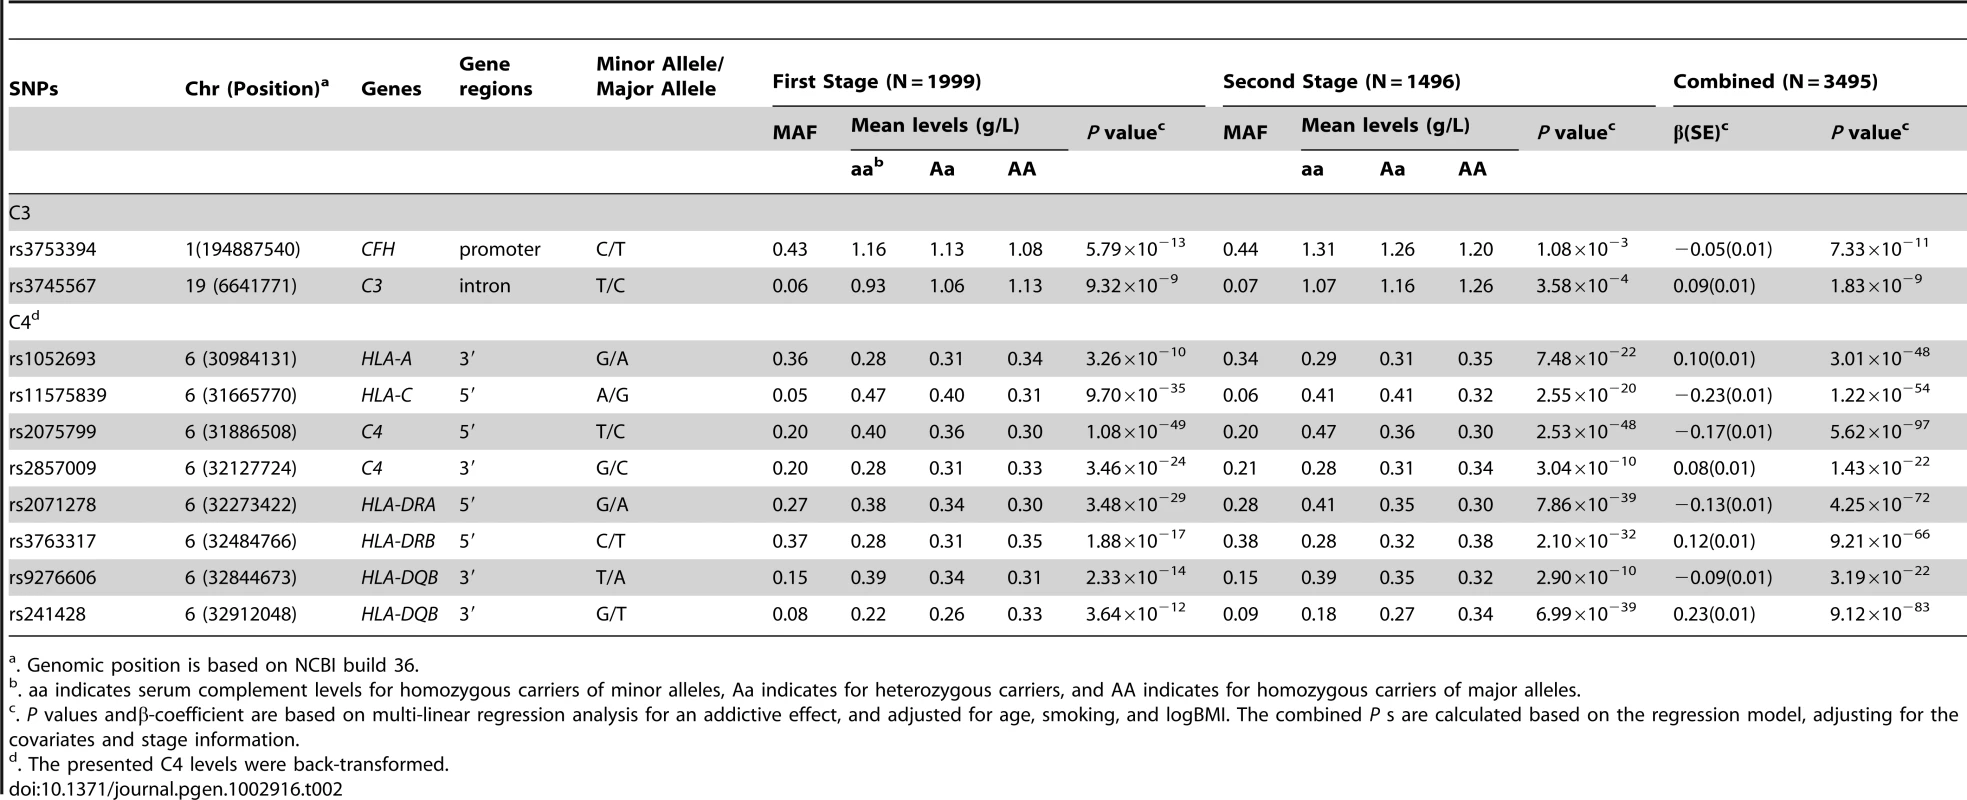
. Genomic position is based on NCBI build 36. GWAS for serum C4 levels
In the first stage, only one genomic locus was significantly associated with serum level of C4 at a genome-wide significant level (Figure 2). All those SNPs that reached a P-value cutoff of 5×10⁻⁸ are located on the 6p21.3 region. A total of eight independent SNPs were selected based on the stepwise procedure, and were followed in the second stage (Figure S5). These significant SNPs reside in a 2-Mb MHC region on chromosome 6p21.3 (Figure 3). Two SNPs (rs1052693 with a P-value of 3.26×10⁻¹⁰, and rs11575839 with a P-value of 9.70×10⁻³⁵) were located in the MHC class I area that include HLA-A, HLA-C, and HLA-B genes. Two SNPs (rs2075799 with a P-value of 1.08×10−49, and rs2857009 with a P-value of 3.46×10⁻²⁴) were located 5′ and 3′ of C4 gene. The other four SNPs, rs2071278, rs3763317, rs9276606, and rs241428 were located in the MHC class II region that includes HLA-DRA, HLA-DRB, and HLA-DQB genes. In stage 2, all eight SNPS were confirmed to be associated with C4 level at a P-value cutoff of 0.006 (Bonferroni correction of eight tests) (P value between 3.04×10⁻¹⁰ and 2.53×10−48). The combined analysis also showed that these SNPs were highly significant associated with C4 levels and reached a genome-wide significant level (P value between 3.19×10⁻²² and 5.62×10−97) (Table 2). In addition, among the eight SNPs we identified, the range of the increase for C4 level per allele was from 0.08 g/l for rs2857009 (SE = 0.01, P = 1.43×10⁻²²), and 0.23 g/l for rs1157839 (SE = 0.01, P = 1.22×10−54). Finally, the proportion of variability in the C4 level explained by the eight SNPs reached 80.5% (R2 = 0.805) in our multi-linear regression model.
Fig. 2. Manhattan plot of genome-wide association analyses for C4 level. 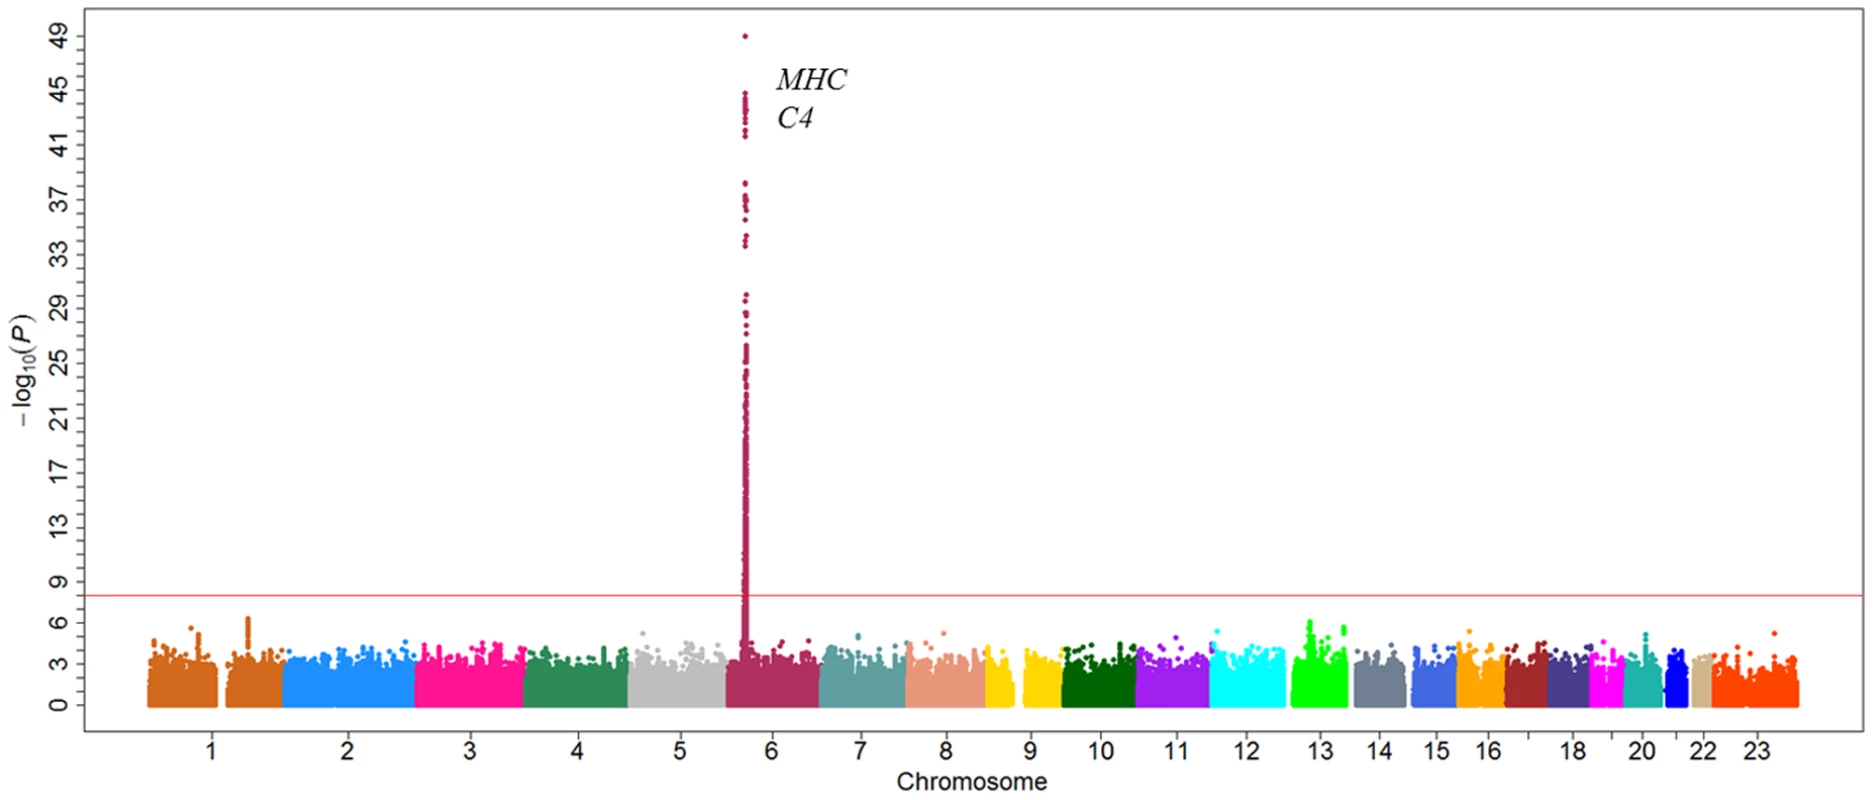
X-axis shows chromosomal positions. Y-axis shows −log10 Pvalues from linear regression adjusted for age and logBMI. C4 level are log-transformed and fit for a normal distribution. The horizontal solid line indicates the preset threshold of P=5×10⁻⁸. Fig. 3. Association of serum C4 levels with SNPs at 6p21.3. 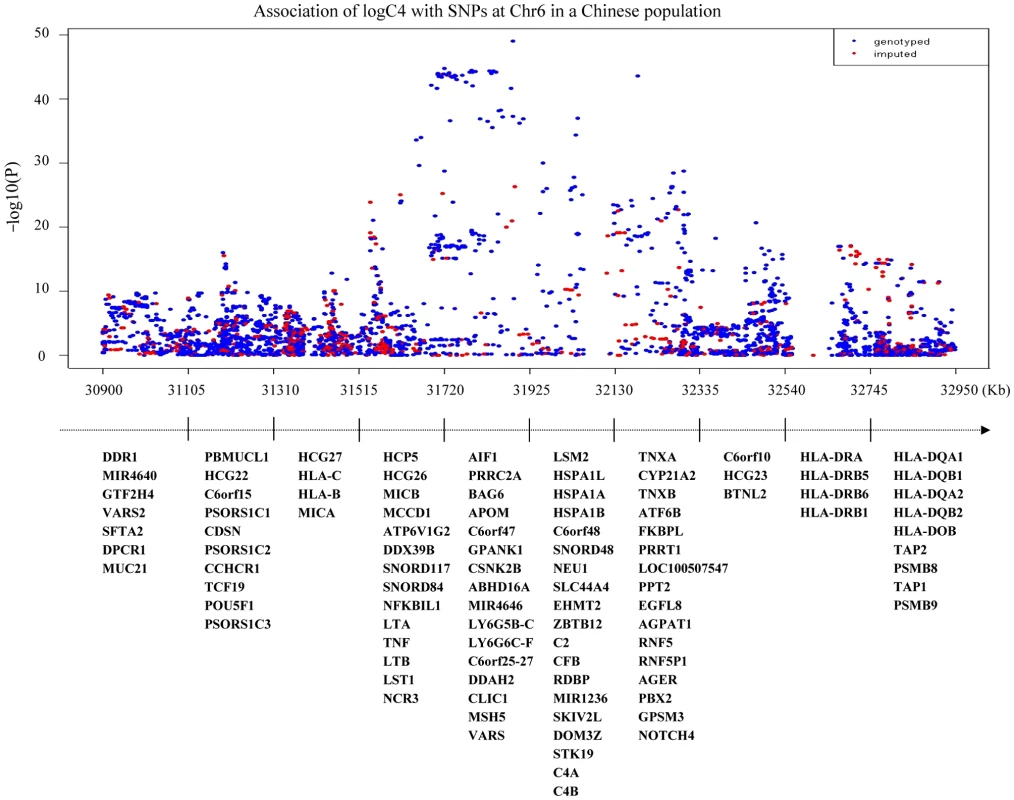
X-axis shows base positions from 30,900 Kb to 32,950 Kb. Y-axis shows –log10 P-values from linear regression adjusted for age and logBMI. C4 level are log-transformed and fit for a normal distribution. The horizontal solid line indicates the preset threshold of P = 5×10⁻⁸. The bottom panels describe all genes in the region. Correlation of C4 gene CNV and serum C4 levels
As shown in Table 3, significant difference of serum C4 level among the varied C4 gene dose groups were observed, with a P value = 3.94×10⁻¹². The serum C4 level was significantly higher with each more copy of C4 gene, with a Ptrend = 5.18×10⁻¹⁸. The lowest C4 gene dose group (N = 3, CNV = 2) only has a mean levels of 0.16±0.03 g/L of C4, which is significantly lower than the group with average number of C4 gene dose (N = 56, CNV = 4; mean value: 0.33±0.01 g/L, P = 5.06×10⁻⁶). The highest C4 gene dose group (N = 3, CNV = 7 or 8) had the mean levels of 0.48±0.04 g/L of C4, which is significantly higher than the general dose group, with a P-value of 8.24×10⁻⁵.
Tab. 3. Quantitative variation of serum C4 levels with C4 gene copy numbers among 100 healthy subjects. 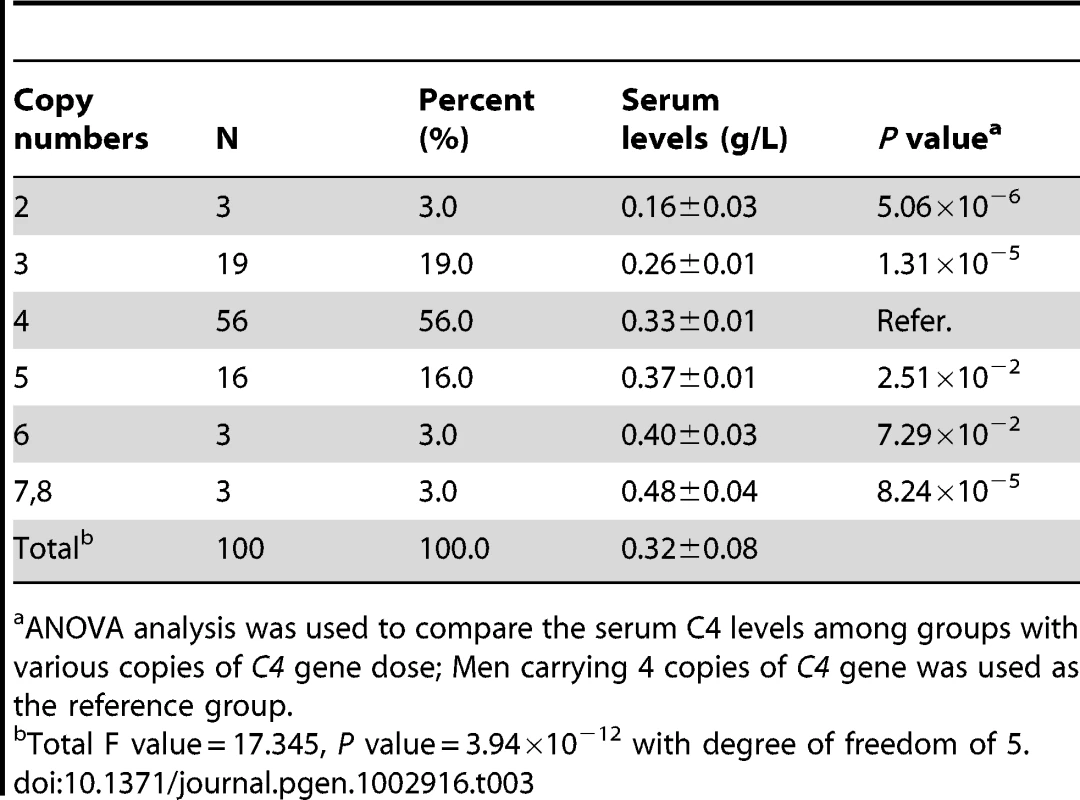
ANOVA analysis was used to compare the serum C4 levels among groups with various copies of C4 gene dose; Men carrying 4 copies of C4 gene was used as the reference group. Discussion
To our knowledge, our study represents one of the first efforts to identify genetic loci that determine the serum levels of C3 and C4 using a two-stage GWAS approach. We identified three independent genetic loci that were significant at a genome-wide significant level (P value<1×10⁻⁸) in a Chinese population of 3,495 healthy men, with a P-value range from 1.83×10⁻⁹ to 5.62×10−99. Those include SNPs rs3745567 (C3 gene) and rs3753394 (CFH-CFHR1 gene cluster) and eight independent SNPs in the ∼2 Mb MHC region on chr6 that were significantly associated with serum level of C3 and C4, respectively.
The first confirmed SNP was rs3753394, which is located within the complement factor H (CFH) and CFH-related gene (CFHR1-5) cluster on 1q31.3. CFH encodes the complement factor H that regulates complement activation on self cells by possessing both cofactor activity for the factor I mediated C3b cleavage, and decay accelerating activity against the alternative pathway C3 convertase [15], [16]. CFHRs contain similar surface recognition region of CFH and there has been evidence that they may play a role in C3b inactivation by binding with C3b [17]. rs3753394 was located in a ∼200 kb LD block region that CFH, CFHR1 and CFHR3 genes. Thus one possibility is that the genetic variants of rs3753394, may affect the expression or function of one of these three genes, which in turn may cause different modulatory activities towards complement C3 and lead to different levels of C3 proteins. We further used the Genevar (GENE Expression VARiation) database to examine whether rs3753394 is associated with gene expression of CFH and CFH-related genes. rs3753394 was found to be significantly associated with the gene expression level of CFHR1 (P = 0.0187) in 156 lymphoblastoid cell line derived from a subset of healthy female twins of the MuTHER resource [18]. No association between rs3753394 and CFH or other CFH family members was found (P>0.05). Thus one plausible hypothesis is that the observed rs3753394-C3 association may be causally related with CFHR1 expression.
The second associated SNP with serum level of C3, rs3745567, is located in the intron region of C3. Two previous candidate gene studies from Japan and UK SLE families, also showed that genetic variants located in C3 gene region significantly influence serum C3 levels in SLE patients. The reported SNPs were rs344555 in the 3′ (P = 0.007) and rs7951 in the exon 35 (P = 0.0024) of C3 [10], [19]. However, neither rs7951 nor rs344555 was significantly associated with C3 level in our healthy study subjects (P = 0.51 and P = 0.16, respectively). We then carefully examined the LD structure for CEU, CHB and JPT based on the HapMap Phase II data. The LD structure greatly differed among those three populations in C3 region (data not shown). Therefore, we may speculate that the previously reported SNP, and the SNP we identified may represent different tagging SNPs for the functional causal SNP in C3 region. The functional variants that reside in C3 gene region need to be further identified.
For C4, all the eight significant SNPs reside in a 2-Mb MHC region on chromosome 6p21. Interestingly, both the complement C4A and C4B genes whose gene products contribute to serum C4 located in the class III region of MHC on 6p21.3 [8], so the C4 locus is the most likely candidate with the MHC. Within the MHC region, the C4 locus (C4A and C4B paralogues) is the most likely candidate gene that is responsible for serum level of C4. Copy number variations of C4 gene, as well as gene size polymorphisms of C4 (short or long form) copy number, are known to determine the serum level of C4 [20], [21]. Based on our CNV analysis from the 100 subjects of the stage 1 population, we showed that the total C4 gene dosages were positively correlated with serum levels of C4. Therefore, we can't exclude the possibilities that the SNPs identified in MHC region may be in LDs with C4 gene copy number or gene size variations. To answer the above question, we evaluated the correlation between C4 gene copy number and the eight SNPs identified. The Pearson correlation coefficients between the eight SNPs and C4 copy number are moderate, with a range of 0.21 to 0.36 (Table S2). However, seven out of eight SNPs were no longer significant after adjustment for C4 copy number variation (Table S2). One SNP (rs2857009) still remained significant after adjustment for copy number variation. This suggested that although the majority of SNPs identified may be correlated with copy numbers of C4, one SNP (rs2857009) may confer independent effect on affecting the concentration of C4. The combination of C4 gene CNV and the SNP information can better explain the genetic components which influence the complement C4 variation. However, we would also like to point out that the above results are based on a relatively small sample size, future studies with a larger sample size is needed to confirm our finding.
Since the identified C4-associated SNPs were located in the MHC region, it will be interesting to know the relationship between those SNPs and known Human Leukocyte Antigens (HLA) alleles. We evaluated whether those eight SNPs and their perfect proxies (r2 = 1 based on HapMap 3 plus 1,000 genome project) tag the known HLA alleles, based on the HLA and SNP haplotype map developed by de Bakker et al [22]. However, none of the eight SNPs or their perfect proxies was found to tag the known HLA alleles in CHB population. Two reasons may potentially explain it. First, the number of individuals that were used to construct such map was small (N = 45). Therefore, haplotypes with relatively low frequencies were not detected. In a recent study, a new HLA and SNP haplotype map was available based on a relatively larger population (N = 3,000), which represented an improved haplotype map with much higher resolution [23]. However, this map was currently available for Caucasians only. Second, our study population represents a southern Chinese population. The LD structure of our population may differ from CHB population, which represents a northern Chinese population. The LD structure may even differ significantly in the highly polymorphic MHC region between CHB and our study population. Therefore, a HLA and SNP haplotype map that is specific to this study population may be more informative to infer the LD between the identified C4 associated SNPs and known HLA alleles.
Some confounding factors, such as age, smoking, BMI, and hsCRP, are predictive of the C3 or C4 levels, however, the most significant covariate for C3 is the BMI (P = 2.88×10⁻⁷) , and age for C4 (P = 5.56×10⁻¹¹) in our multivariate linear model which also included novel SNPs identified in this study. Together, those variables could explain more than 90% of variance of C4 level (R2>0.90). Serum level of high-sensitivity Chronic Reactive Protein (hsCRP) levels, which is a potential confounder for the acute phase reactants C3 and C4 protein, was also available in our dataset. Further adjustment of hsCRP revealed similar results (Table S1). Considering the high infection rate of hepatitis B virus in the general Chinese population and its potential influence for complement, we furthermore carried out interaction analysis of infection-by-genotype. Although both the C3 and C4 levels in the HBsAg positive group were significantly lower than the negative group in the combined 3495 subjects (1.09±0.21 vs1.18±0.34 for C3 and 0.32±0.09 vs 0.34±0.10 for C4, P<0.05, respectively), however, no significant interaction was observed between HBsAg infection and previous identified SNPs in our multivariate linear regression model, P>0.05, respectively. The potential cause could be that the synthesis ability of complements was still normal in the liver organ.
In summary, through a two-stage GWAS of 3,495 healthy Chinese male subjects, we identified CFH and C3 loci were significantly associated with serum level of C3, and a ∼2 Mb loci on 6p21.3 region was significantly associated with serum level of C4. The selection of healthy subjects from one centralized resource and the stringent inclusion and exclusion criteria were considered as two of the advantages of our study design. Our study would contribute to the understanding of genetic components that affect individual level of complement variation. It may also shed light on the etiology and molecular mechanisms for C3 and C4 related diseases.
Supporting Information
Zdroje
1. WalportMJ (2001) Complement. First of two parts. The New England journal of medicine 344 : 1058–1066.
2. WalportMJ (2001) Complement. Second of two parts. The New England journal of medicine 344 : 1140–1144.
3. GadjevaM, ThielS, JenseniusJC (2001) The mannan-binding-lectin pathway of the innate immune response. Current opinion in immunology 13 : 74–78.
4. InoueH, MashimoY, FunamizuM, ShimojoN, HasegawaK, et al. (2008) Association study of the C3 gene with adult and childhood asthma. Journal of human genetics 53 : 728–738.
5. UnsworthDJ (2008) Complement deficiency and disease. Journal of clinical pathology 61 : 1013–1017.
6. SeppanenM, LokkiML, TimonenT, LappalainenM, JarvaH, et al. (2001) Complement C4 deficiency and HLA homozygosity in patients with frequent intraoral herpes simplex virus type 1 infections. Clinical infectious diseases : an official publication of the Infectious Diseases Society of America 33 : 1604–1607.
7. SotoK, WuYL, OrtizA, AparicioSR, YuCY (2010) Familial C4B deficiency and immune complex glomerulonephritis. Clinical immunology 137 : 166–175.
8. WuYL, HauptmannG, ViguierM, YuCY (2009) Molecular basis of complete complement C4 deficiency in two North-African families with systemic lupus erythematosus. Genes and immunity 10 : 433–445.
9. HunnangkulS, NitschD, RhodesB, ChadhaS, RobertonCA, et al. (2008) Familial clustering of non-nuclear autoantibodies and C3 and C4 complement components in systemic lupus erythematosus. Arthritis and rheumatism 58 : 1116–1124.
10. RhodesB, HunnangkulS, MorrisDL, HsaioLC, GrahamDS, et al. (2009) The heritability and genetics of complement C3 expression in UK SLE families. Genes and immunity 10 : 525–530.
11. TanA, GaoY, YangX, ZhangH, QinX, et al. (2011) Low serum osteocalcin level is a potential marker for metabolic syndrome: results from a Chinese male population survey. Metabolism 60 : 1186–1192.
12. MarchiniJ, HowieB, MyersS, McVeanG, DonnellyP (2007) A new multipoint method for genome-wide association studies by imputation of genotypes. Nature genetics 39 : 906–913.
13. PurcellS, NealeB, Todd-BrownK, ThomasL, FerreiraMA, et al. (2007) PLINK: a tool set for whole-genome association and population-based linkage analyses. American journal of human genetics 81 : 559–575.
14. PriceAL, PattersonNJ, PlengeRM, WeinblattME, ShadickNA, et al. (2006) Principal components analysis corrects for stratification in genome-wide association studies. Nat Genet 38 : 904–909.
15. PangburnMK (2000) Host recognition and target differentiation by factor H, a regulator of the alternative pathway of complement. Immunopharmacology 49 : 149–157.
16. Rodriguez de CordobaS, Esparza-GordilloJ, Goicoechea de JorgeE, Lopez-TrascasaM, Sanchez-CorralP (2004) The human complement factor H: functional roles, genetic variations and disease associations. Molecular immunology 41 : 355–367.
17. JozsiM, ZipfelPF (2008) Factor H family proteins and human diseases. Trends Immunol 29 : 380–387.
18. NicaAC, PartsL, GlassD, NisbetJ, BarrettA, et al. The architecture of gene regulatory variation across multiple human tissues: the MuTHER study. PLoS Genet 7: e1002003 doi:10.1371/journal.pgen.1002003.
19. MiyagawaH, YamaiM, SakaguchiD, KiyoharaC, TsukamotoH, et al. (2008) Association of polymorphisms in complement component C3 gene with susceptibility to systemic lupus erythematosus. Rheumatology 47 : 158–164.
20. YangY, ChungEK, ZhouB, BlanchongCA, YuCY, et al. (2003) Diversity in intrinsic strengths of the human complement system: serum C4 protein concentrations correlate with C4 gene size and polygenic variations, hemolytic activities, and body mass index. J Immunol 171 : 2734–2745.
21. SaxenaK, KitzmillerKJ, WuYL, ZhouB, EsackN, et al. (2009) Great genotypic and phenotypic diversities associated with copy-number variations of complement C4 and RP-C4-CYP21-TNX (RCCX) modules: a comparison of Asian-Indian and European American populations. Mol Immunol 46 : 1289–1303.
22. de BakkerPI, McVeanG, SabetiPC, MirettiMM, GreenT, et al. (2006) A high-resolution HLA and SNP haplotype map for disease association studies in the extended human MHC. Nat Genet 38 : 1166–1172.
23. RaychaudhuriS, SandorC, StahlEA, FreudenbergJ, LeeHS, et al. Five amino acids in three HLA proteins explain most of the association between MHC and seropositive rheumatoid arthritis. Nat Genet 44 : 291–296.
Štítky
Genetika Reprodukčná medicína
Článek Role of Transposon-Derived Small RNAs in the Interplay between Genomes and Parasitic DNA in RiceČlánek Tetraspanin Is Required for Generation of Reactive Oxygen Species by the Dual Oxidase System inČlánek An Essential Role of Variant Histone H3.3 for Ectomesenchyme Potential of the Cranial Neural CrestČlánek A Mimicking-of-DNA-Methylation-Patterns Pipeline for Overcoming the Restriction Barrier of BacteriaČlánek A Genome-Wide Association Study Identifies Five Loci Influencing Facial Morphology in Europeans
Článok vyšiel v časopisePLOS Genetics
Najčítanejšie tento týždeň
2012 Číslo 9- Gynekologové a odborníci na reprodukční medicínu se sejdou na prvním virtuálním summitu
- Je „freeze-all“ pro všechny? Odborníci na fertilitu diskutovali na virtuálním summitu
-
Všetky články tohto čísla
- Heterozygous Mutations in DNA Repair Genes and Hereditary Breast Cancer: A Question of Power
- GWAS of Diabetic Nephropathy: Is the GENIE out of the Bottle?
- The Conflict within and the Escalating War between the Sex Chromosomes
- Proteome-Wide Analysis of Disease-Associated SNPs That Show Allele-Specific Transcription Factor Binding
- Exome Sequencing Identifies Rare Deleterious Mutations in DNA Repair Genes and as Potential Breast Cancer Susceptibility Alleles
- A Gene Family Derived from Transposable Elements during Early Angiosperm Evolution Has Reproductive Fitness Benefits in
- Genome-Wide Association Study for Serum Complement C3 and C4 Levels in Healthy Chinese Subjects
- Role of Transposon-Derived Small RNAs in the Interplay between Genomes and Parasitic DNA in Rice
- Co-Evolution of Mitochondrial tRNA Import and Codon Usage Determines Translational Efficiency in the Green Alga
- SIRT6/7 Homolog SIR-2.4 Promotes DAF-16 Relocalization and Function during Stress
- CNV Formation in Mouse Embryonic Stem Cells Occurs in the Absence of Xrcc4-Dependent Nonhomologous End Joining
- Tetraspanin Is Required for Generation of Reactive Oxygen Species by the Dual Oxidase System in
- Citrullination of Histone H3 Interferes with HP1-Mediated Transcriptional Repression
- Variation in Genes Related to Cochlear Biology Is Strongly Associated with Adult-Onset Deafness in Border Collies
- The Long Non-Coding RNA Affects Chromatin Conformation and Expression of , but Does Not Regulate Its Imprinting in the Developing Heart
- Rif2 Promotes a Telomere Fold-Back Structure through Rpd3L Recruitment in Budding Yeast
- Is a Metastasis Susceptibility Gene That Suppresses Metastasis by Modifying Tumor Interaction with the Cell-Mediated Immunity
- The p38/MK2-Driven Exchange between Tristetraprolin and HuR Regulates AU–Rich Element–Dependent Translation
- Rare Copy Number Variants Contribute to Congenital Left-Sided Heart Disease
- A Genetic Basis for a Postmeiotic X Versus Y Chromosome Intragenomic Conflict in the Mouse
- An Essential Role of Variant Histone H3.3 for Ectomesenchyme Potential of the Cranial Neural Crest
- Characterization of Inducible Models of Tay-Sachs and Related Disease
- Hominoid-Specific Protein-Coding Genes Originating from Long Non-Coding RNAs
- Transcriptional Repression of Hox Genes by HP1/HPL and H1/HIS-24
- Integrative Genomic Analysis Identifies Isoleucine and CodY as Regulators of Virulence
- Convergence of the Transcriptional Responses to Heat Shock and Singlet Oxygen Stresses
- Genomics of Adaptation during Experimental Evolution of the Opportunistic Pathogen
- Enrichment of HP1a on Drosophila Chromosome 4 Genes Creates an Alternate Chromatin Structure Critical for Regulation in this Heterochromatic Domain
- Vsx2 Controls Eye Organogenesis and Retinal Progenitor Identity Via Homeodomain and Non-Homeodomain Residues Required for High Affinity DNA Binding
- The Long Path from QTL to Gene
- TCF7L2 Modulates Glucose Homeostasis by Regulating CREB- and FoxO1-Dependent Transcriptional Pathway in the Liver
- The Non-Flagellar Type III Secretion System Evolved from the Bacterial Flagellum and Diversified into Host-Cell Adapted Systems
- Complex Chromosomal Rearrangements Mediated by Break-Induced Replication Involve Structure-Selective Endonucleases
- Factors That Promote H3 Chromatin Integrity during Transcription Prevent Promiscuous Deposition of CENP-A in Fission Yeast
- A Mimicking-of-DNA-Methylation-Patterns Pipeline for Overcoming the Restriction Barrier of Bacteria
- Determinants of Human Adipose Tissue Gene Expression: Impact of Diet, Sex, Metabolic Status, and Genetic Regulation
- Genome-Wide Association Studies Identify Heavy Metal ATPase3 as the Primary Determinant of Natural Variation in Leaf Cadmium in
- Tethering of the Conserved piggyBac Transposase Fusion Protein CSB-PGBD3 to Chromosomal AP-1 Proteins Regulates Expression of Nearby Genes in Humans
- A Genome-Wide Association Study Identifies Five Loci Influencing Facial Morphology in Europeans
- Normal DNA Methylation Dynamics in DICER1-Deficient Mouse Embryonic Stem Cells
- H4K20me1 Contributes to Downregulation of X-Linked Genes for Dosage Compensation
- The NDR Kinase Scaffold HYM1/MO25 Is Essential for MAK2 MAP Kinase Signaling in
- Coevolution within and between Regulatory Loci Can Preserve Promoter Function Despite Evolutionary Rate Acceleration
- New Susceptibility Loci Associated with Kidney Disease in Type 1 Diabetes
- SWI/SNF-Like Chromatin Remodeling Factor Fun30 Supports Point Centromere Function in
- A Response Regulator Interfaces between the Frz Chemosensory System and the MglA/MglB GTPase/GAP Module to Regulate Polarity in
- Functional Variants in and Involved in Activation of the NF-κB Pathway Are Associated with Rheumatoid Arthritis in Japanese
- Two Distinct Repressive Mechanisms for Histone 3 Lysine 4 Methylation through Promoting 3′-End Antisense Transcription
- Genetic Modifiers of Chromatin Acetylation Antagonize the Reprogramming of Epi-Polymorphisms
- UTX and UTY Demonstrate Histone Demethylase-Independent Function in Mouse Embryonic Development
- A Comparison of Brain Gene Expression Levels in Domesticated and Wild Animals
- PLOS Genetics
- Archív čísel
- Aktuálne číslo
- Informácie o časopise
Najčítanejšie v tomto čísle- Enrichment of HP1a on Drosophila Chromosome 4 Genes Creates an Alternate Chromatin Structure Critical for Regulation in this Heterochromatic Domain
- Normal DNA Methylation Dynamics in DICER1-Deficient Mouse Embryonic Stem Cells
- The NDR Kinase Scaffold HYM1/MO25 Is Essential for MAK2 MAP Kinase Signaling in
- Functional Variants in and Involved in Activation of the NF-κB Pathway Are Associated with Rheumatoid Arthritis in Japanese
Prihlásenie#ADS_BOTTOM_SCRIPTS#Zabudnuté hesloZadajte e-mailovú adresu, s ktorou ste vytvárali účet. Budú Vám na ňu zasielané informácie k nastaveniu nového hesla.
- Časopisy


