-
Články
- Časopisy
- Kurzy
- Témy
- Kongresy
- Videa
- Podcasty
Embryogenesis Scales Uniformly across Temperature in Developmentally Diverse Species
Temperature profoundly impacts the rate of development of “cold-blooded” animals, which proceeds far faster when it is warm. There is, however, no universal relationship. Closely related species can develop at markedly different speeds at the same temperature. This creates a major challenge when comparing development among species, as it is unclear whether they should be compared at the same temperature or under different conditions to maintain the same developmental rate. Facing this challenge while working with flies (Drosophila species), we found there was little data to inform this decision. So, using time-lapse imaging, precise temperature-control, and computational and manual video-analysis, we tracked the complex process of embryogenesis in 11 species at seven different temperatures. There was over a three-fold difference in developmental rate between the fastest species at its fastest temperature and the slowest species at its slowest temperature. However, our finding that the timing of events within development all scaled uniformly across species and temperatures astonished us. This is good news for developmental biologists, since we can induce species to develop nearly identically by growing them at different temperatures. But it also means flies must possess some unknown clock-like molecular mechanism driving embryogenesis forward.
Published in the journal: Embryogenesis Scales Uniformly across Temperature in Developmentally Diverse Species. PLoS Genet 10(4): e32767. doi:10.1371/journal.pgen.1004293
Category: Research Article
doi: https://doi.org/10.1371/journal.pgen.1004293Summary
Temperature profoundly impacts the rate of development of “cold-blooded” animals, which proceeds far faster when it is warm. There is, however, no universal relationship. Closely related species can develop at markedly different speeds at the same temperature. This creates a major challenge when comparing development among species, as it is unclear whether they should be compared at the same temperature or under different conditions to maintain the same developmental rate. Facing this challenge while working with flies (Drosophila species), we found there was little data to inform this decision. So, using time-lapse imaging, precise temperature-control, and computational and manual video-analysis, we tracked the complex process of embryogenesis in 11 species at seven different temperatures. There was over a three-fold difference in developmental rate between the fastest species at its fastest temperature and the slowest species at its slowest temperature. However, our finding that the timing of events within development all scaled uniformly across species and temperatures astonished us. This is good news for developmental biologists, since we can induce species to develop nearly identically by growing them at different temperatures. But it also means flies must possess some unknown clock-like molecular mechanism driving embryogenesis forward.
Introduction
It has long been known that Drosophila, like most poikilotherms, develops faster at higher temperatures, with embryonic [1], larval [1], [2], and pupal stages [3], [4], as well as total lifespan [5], [6] showing similar logarithmic trends. While genetics, ecology, and evolution of this trait have been investigated for over a century [2], [7]–[17], the effects of temperature on the order and relative timing of developmental events, especially within embryogenesis, are poorly understood.
We became interested in the relationship between species, temperature, and the cadence of embryogenesis for practical reasons. Several years ago, we initiated experiments looking at the genome-wide binding of transcription factors in the embryos of divergent Drosophila species: D. melanogaster, D. pseudoobscura, and D. virilis. With transcription factor binding a highly dynamic process, we tried to match both the conditions (especially temperature, which we believed would affect transcription factor binding) in which embryos were collected and the developmental stages we analyzed. However, our initial attempts to collect D. pseudoobscura embryos at 25°C — the temperature at which we collect D. melanogaster — were unsuccessful, with large numbers of embryos failing to develop, likely a consequence of D. pseudoobscura's alpine origin. While D. virilis lays readily at 25°C, we found that their embryos develop more slowly than D. melanogaster, complicating the collection of developmental stage-matched samples.
Having encountered such challenges with just three species, and planning to expand to many more, we were faced with several important questions. Given that embryogenesis occurs at different rates in different species [8], [18], how should we time collections to get the same mix of stages we get from our standard 2.5–3.5 hour collections in D. melanogaster, or any other stage we study in the future? Is it better to compare embryos collected at the same temperature even if it is not optimal for, or even excludes, some species; or, should we collect embryos from each species at their optimal temperature, if such a thing exists? Should we select a temperature for each species so that they all develop with a similar velocity? Or should we find a set of species that develop at the same speed at a common temperature? And even if we could match the overall rate of development, would heterochronic effects mean that we could not get an identical mix of stages?
We found a woeful lack in the kind of data needed to answer these questions. Powsner precisely measured the effect of temperature on the total duration of embryogenesis in D. melanogaster [1], and Markow made similar measurements for other Drosophila species at a fixed temperature (24°C) [18], but the precise timing of events within embryogenesis had been described only for D. melanogaster at 25°C [19], [20].
The work described here was born to address this deficiency. We used a combination of precise temperature control, time-lapse imaging, and careful annotation to catalog the effects of a wide range of temperatures on embryonic development in 11 Drosophila species from diverse climates. We focused on species with published genome sequences [21] (Table 1), as these are now preferentially used for comparative and evolutionary studies. Of the species we studied D. melanogaster, D. ananassae, D. erecta, D. sechellia, D. simulans, D. willistoni, and D. yakuba are all native to the tropics, though D. melanogaster, D. ananassae, and D. simulans have spread recently to become increasingly cosmopolitan [17]. D. mojavensis is a sub-tropical species, while D. virilis is a temperate species that has become holarctic and D. persimilis and D. pseudoobscura are alpine species (Figure 1A).
Fig. 1. Geographic and climatic origin and phylogeny of analyzed Drosophila species. 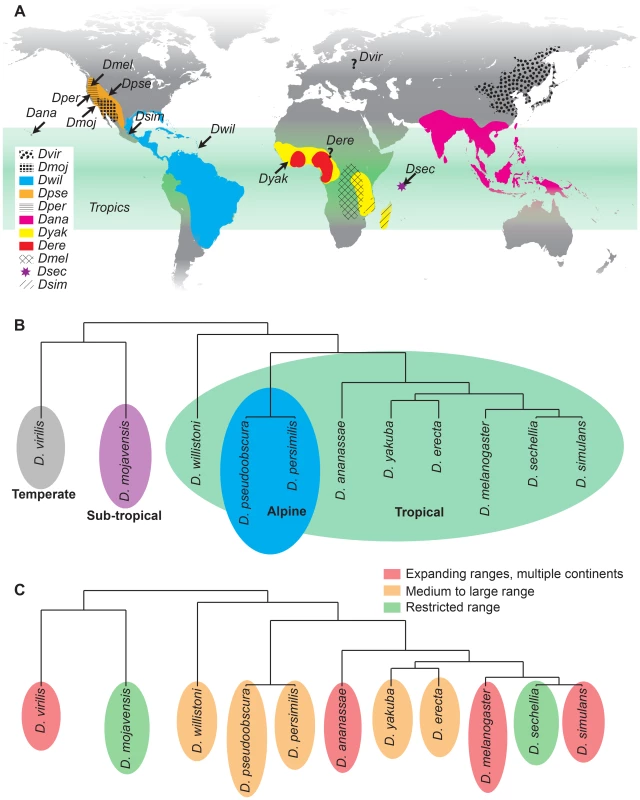
(A) Ancestral ranges are shown for each species [17], [47],[48]. While D. melanogaster and D. simulans are now cosmopolitan and D. ananassae is expanding in the tropics (green), their presumed ancestral ranges are shown. D. virilis is holarctic (gray) and restricted from the tropics, with a poor understanding of its ancestral range. Other species are more or less found in their native ranges, covering a variety of climates. Sites of collection are noted by arrows. (B) The phylogeny of the sequenced Drosophila species. Many of the tropical species are closely related, though D. willistoni serves as a tropical out-group compared to the melanogaster and obscura groups. Branch lengths are based on evolutionary divergence times [49]. (C) Range sizes vary considerably between the species. Tab. 1. <i>Drosophila</i> species and strains. 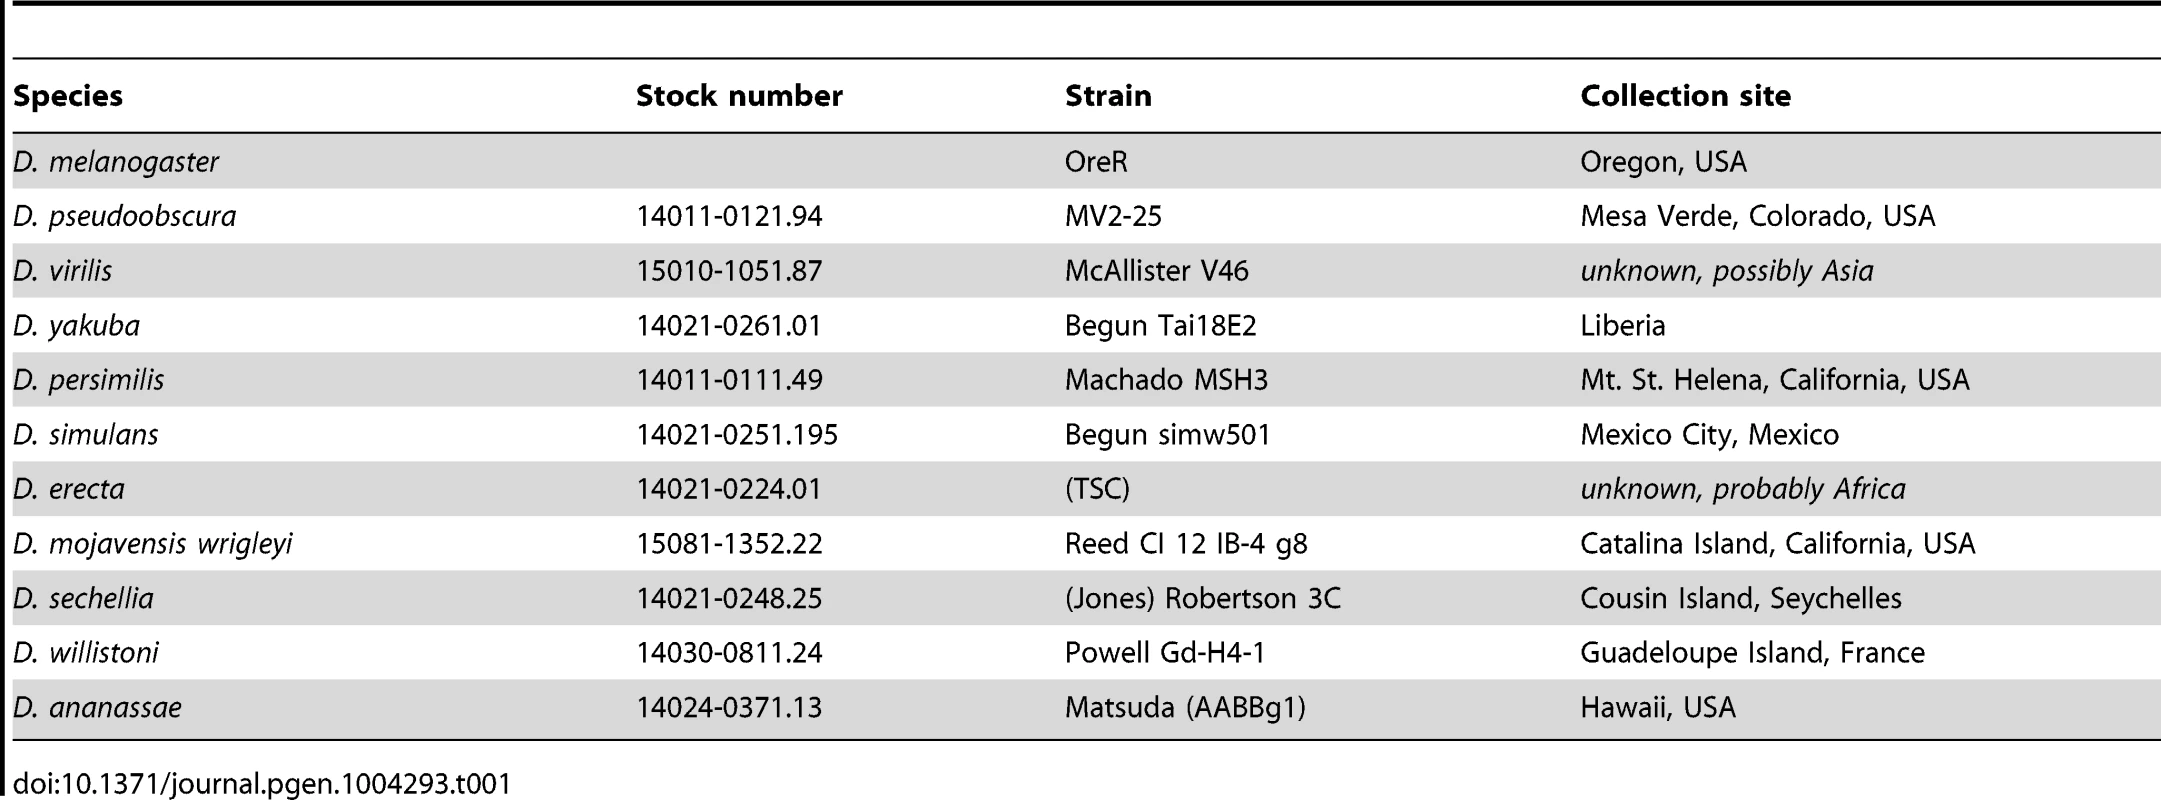
Results
Time-lapse imaging tracks major morphological events
We used automated, time-lapse imaging to track the development of embryos held at a constant and precise temperature from early embryogenesis (pre-cellularization) to hatching. We maintained the temperature at 0.1°C using thermoelectric Peltier heat pumps. Different sets of embryos were analyzed at temperatures ranging from 17.5°C to 32.5°C, in 2.5°C increments. Images were taken every one to five minutes, depending on the total time of development. A minimum of four embryos from each species were imaged for each temperature, for a total of 77 conditions. In total, time-lapse image series were collected and analyzed from over 1000 individual embryos.
We encountered, and solved, several challenges in designing the experimental setup, including providing the embryos with sufficient oxygen [22], [23] and humidity. We found that glass slides were problematic due to a lack of oxygenation and led to a 28% increase in developmental time, so we instead employed an oxygen-permeable tissue culture membrane, mounted on a copper plate to maintain thermal conduction. At higher temperatures, we found that the embryos dehydrated, so humidifiers were used to increase ambient humidity. Detailed photos of the apparatus and descriptions can be found in Figure S1.
We used a series of simple computational transformations (implemented in Matlab) to orient each embryo, correct for shifting focus, and adjust the brightness and contrast of the images, creating a time-lapse movie for each embryo. We manually examined images from 60 time-lapse series in D. melanogaster and identified 36 distinct developmental stages [19], [20] that could be recognized in our movies (Table 2, http://www.youtube.com/watch?v=dYSrXK3o86I and http://www.youtube.com/watch?v=QKVmRy3dDR0 or “D. melanogaster with labelled stages” and “D. melanogaster with labelled stages at reduced framerate” in DOI:10.5061/dryad.s0p50”). Due to the volume of images collected, we implemented a semi-automated system to annotate our entire movie collection. Briefly, images from matching stages in manually annotated D. melanogaster movies were averaged to generate composite reference images for each stage (Figure 2). We then used a Matlab script to find the image-matrix correlation between each of these composite reference images to the images in each time-lapse to estimate the timing of each morphological stage via the local correlation maximum (Figure S2A).
Fig. 2. Developmental landmarks used in study. 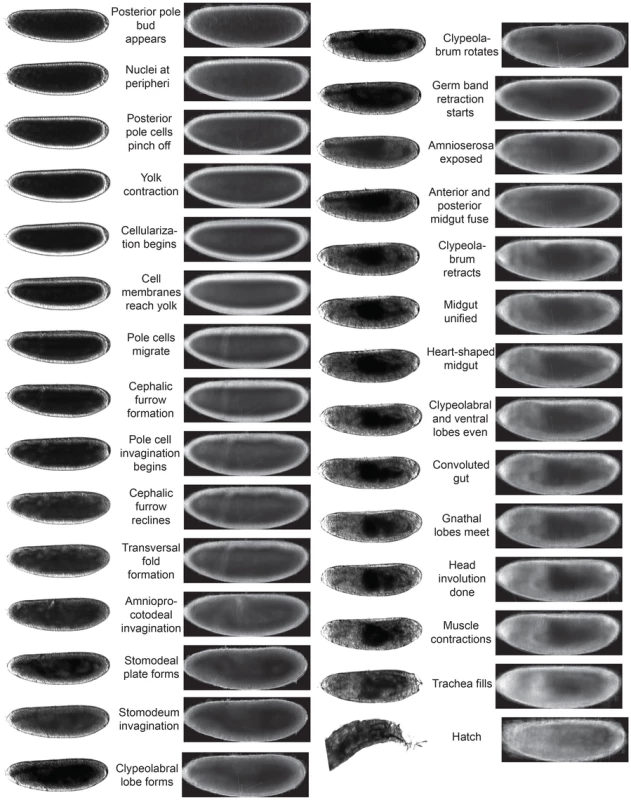
Many images of each stage (examples on the left) were averaged to generate composite images (lateral view on the right) for each of the developmental stages, of which 29 are shown. Tab. 2. Major morphological events in <i>Drosophila</i> development. 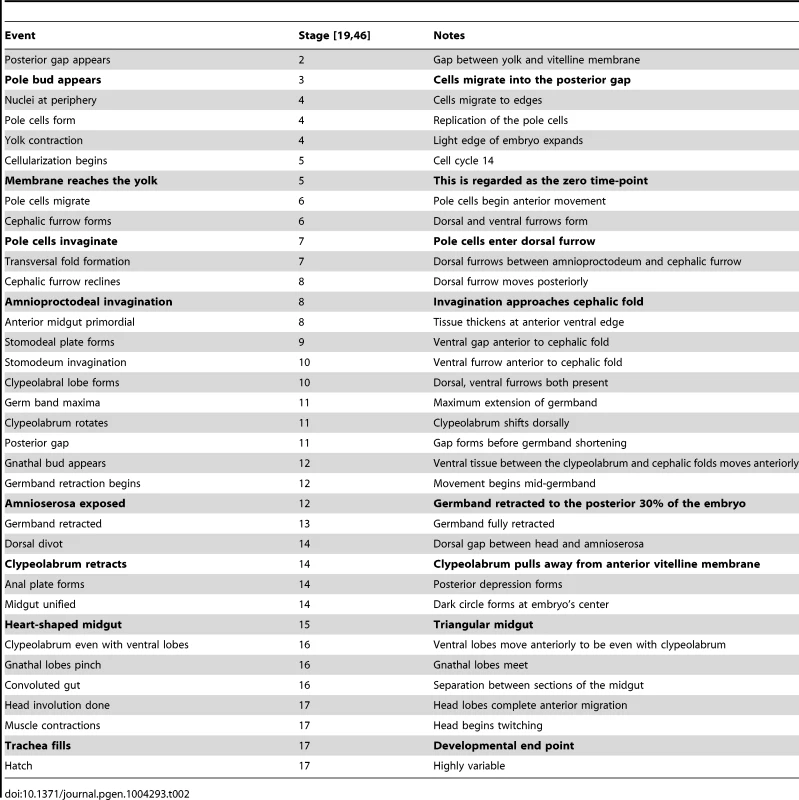
Of the 36 events, the eight most unambiguous events (Figure S3), identifiable regardless of embryo orientation, were selected for refinement and further analysis (pole bud appears, membrane reaches yolk, pole cell invagination, amnioproctodeal invagination, amnioserosa exposed, clypeolabrum retracts, heart-shaped midgut, and trachea fill) (Figure S2B,C). Using a Python-scripted graphical user interface, each of the eight events in every movie was manually examined and the algorithm prediction adjusted when necessary. Timing of hatching was excluded from these nine primary events because it was highly variable, likely due to the assay conditions following dechorionation, and suitable only as an indication of successful development, not as a reliable and reproducible time point. The “membrane reaches yolk stage” was used throughout as a zero point due to the precision with which the stage could be identified in all species and from all orientations.
Links to representative time-lapse videos are provided in Table 3.
Tab. 3. Drosophila development videos. 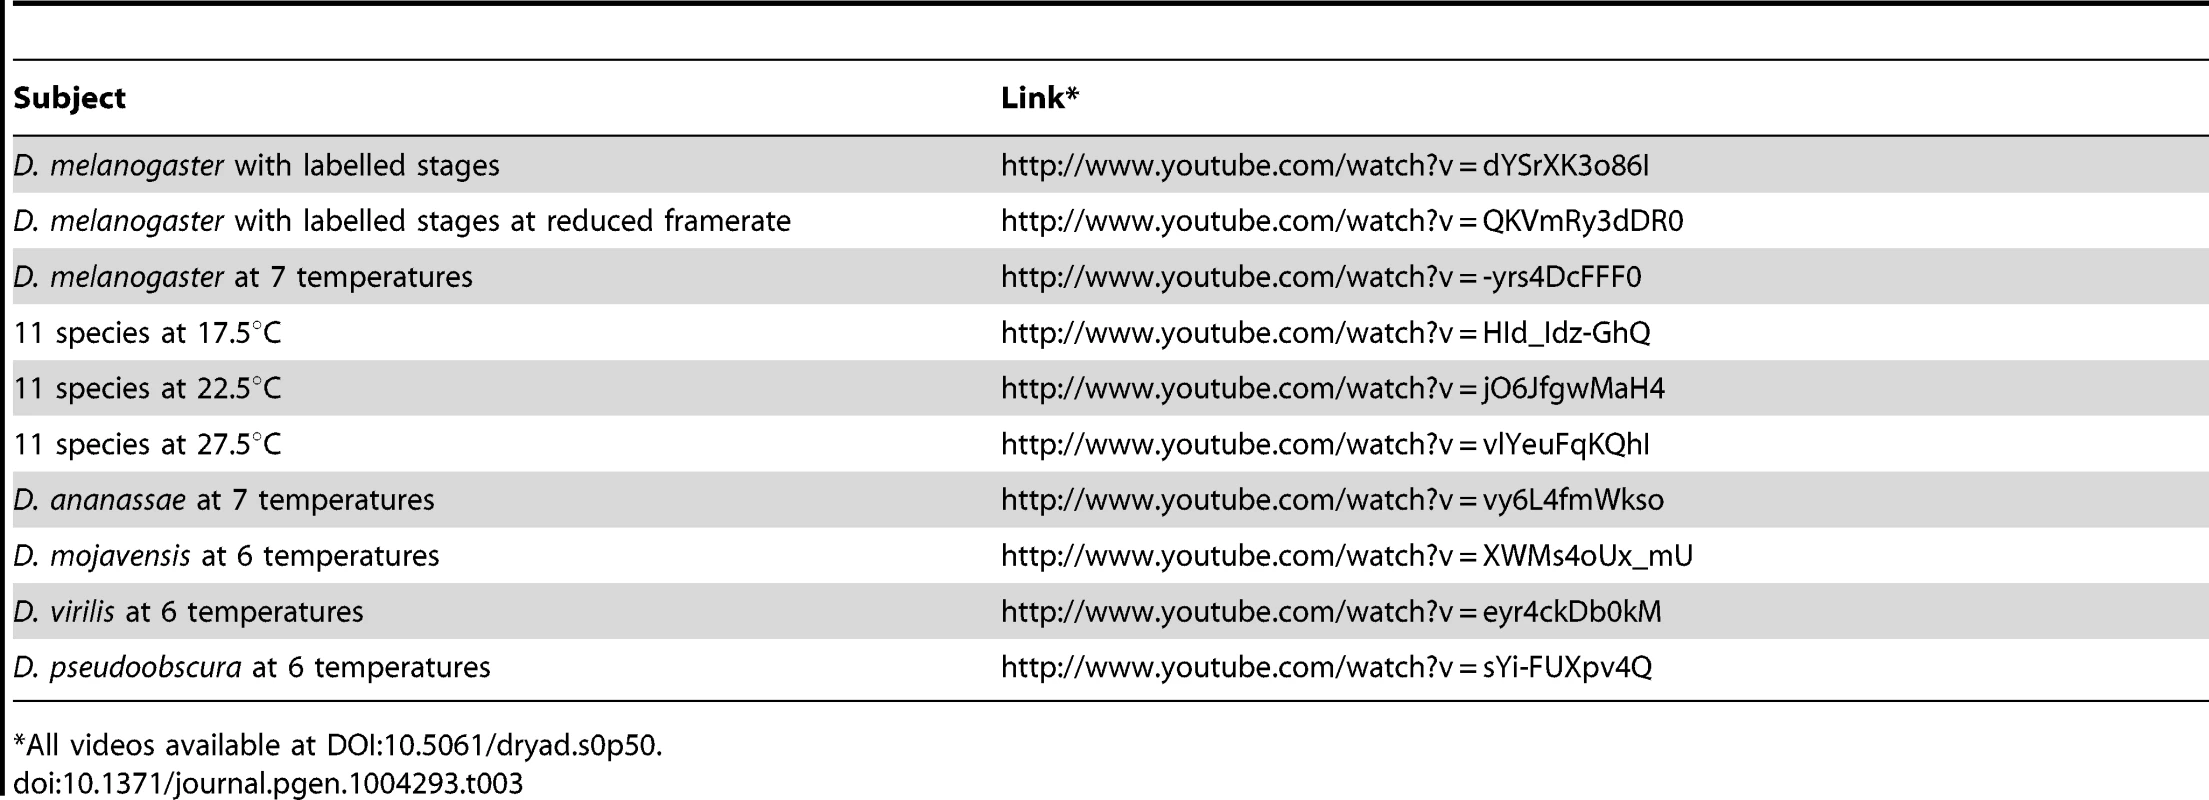
*All videos available at DOI:10.5061/dryad.s0p50. D. melanogaster embryogenesis scales uniformly with temperature
As expected, the total time of embryogenesis of D. melanogaster had a very strong dependence on temperature (Figure 3, http://www.youtube.com/watch?v=-yrs4DcFFF0 or “D. melanogaster at 7 temperatures” in DOI:10.5061/dryad.s0p50). From 17.5°C to 27.5°C, there was a two-fold acceleration in developmental rate, matching the previously observed doubling of total lifespan with a 10°C change in temperature [6]. The velocity of embryogenesis at 30°C is roughly the same as at 27.5°C, and is appreciably slower at 32.5°C, likely due to heat stress. At 35°C, successful development becomes extremely rare.
Fig. 3. Developmental time of D. melanogaster varies with temperature. 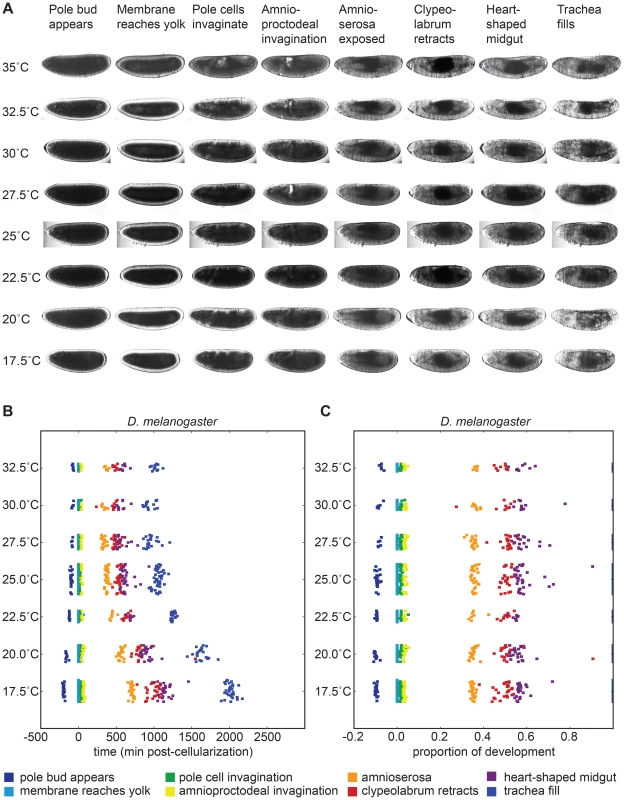
(A) Images of developing D. melanogaster embryos at each temperature are shown for a selection of stages to highlight the overall similarity of development. (B) The time individual animals reached the various time-points are shown, with each event being a different color. Time 0 is defined as the end of cellularization, when the membrane invagination reaches the yolk. Between 17.5°C and 27.5°C the total time of embryogenesis, measured as the mean time between cellularization and trachea fill, has a logarithmic relationship to temperature described by where T is temperature in °C (). (C) The developmental rate in D. melanogaster changes uniformly with temperature, not preferentially affecting any stage. Timing here is normalized between the end of cellularization and the filling of the trachea. To examine how these temperature-induced shifts in the total time of embryogenesis were reflected in the relative timing of individual events, we rescaled the time series data for each embryo so that the time from our most reliable early landmark (the end of cellularization) to our most reliable late landmark (trachea filling) was identical, and examined where each of the remaining landmarks fell (Figure 3C). We were surprised to find that D. melanogaster exhibited no major changes in its proportional developmental time under any of the non-stressful temperature conditions tested. Therefore, at least as far as most visually evident morphological features go, embryogenesis scales uniformly across a two-fold range of total time.
When the embryos were under heat stress (30°C), we observed a very slight contraction in the proportion of time between early development (pole bud appears) to the end of cellularization (membrane reaches yolk), and a slight contraction between the end of cellularization and mid-germ band retraction (amnioserosa exposure).
Embryogenesis scales uniformly across species despite significant differences in temperature dependent developmental rate
In each of the ten additional Drosophila species we examined we observed all of the 36 developmental landmarks we identified in D. melanogaster in the same temporal order (Figure 4A). However, there was marked interspecies variation in both the total time of embryogenesis at a given temperature (Figure 4B–E, Table 3) and the way embryogenesis time varied with temperature (Figure 5).
Fig. 4. Drosophila species develop at different rates and respond to temperature in distinct ways. 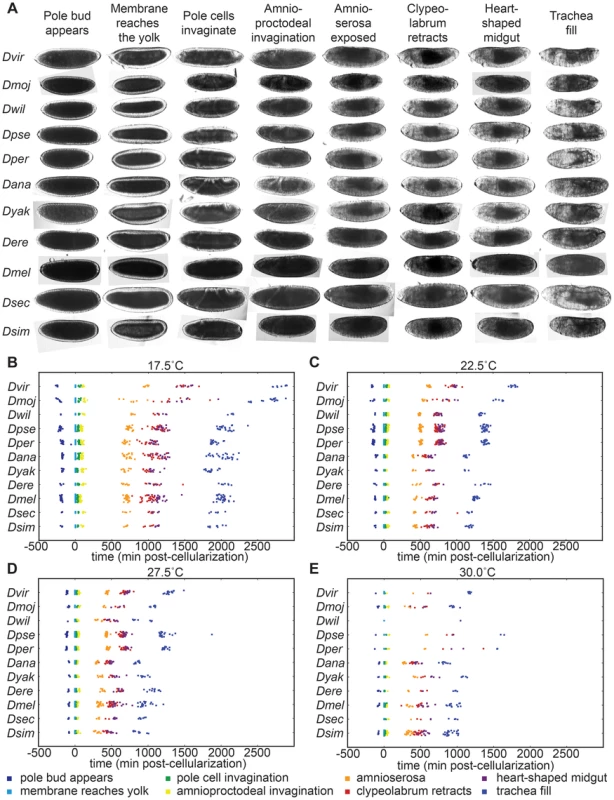
(A) Images of developing embryos of each species are shown to scale. All species go through the same stages in the same order at all viable temperatures. (B) At 17.5°C all species show uniformly long developmental times, with D. virilis and D. mojavensis being significantly longer than other species. (C) At 22.5°C and (D) 27.5°C there is considerably more variation between species. While developmental times decrease with increasing temperature across all species, the effect is muted in the alpine species. (E) At 30°C, developmental rate has stopped accelerating and the alpine species are seeing considerable slow-down in development time. Fig. 5. Temperature dependent developmental rates are climate specific. 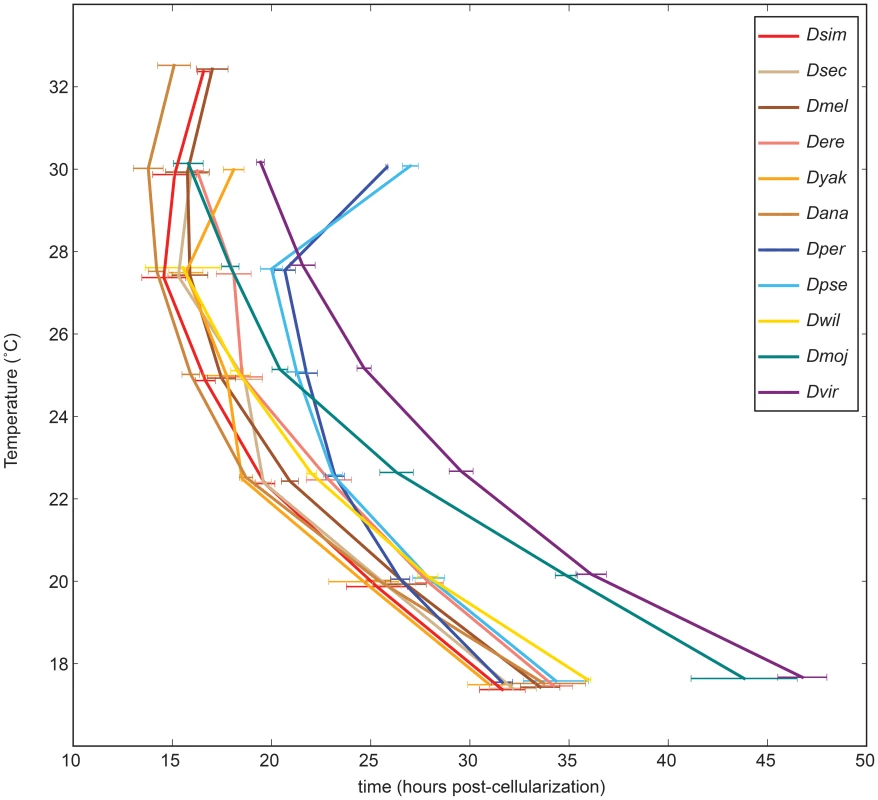
The time between the end of cellularization and trachea fill are shown for all species at a range of temperatures. The climatic groups – tropical (warm colors), alpine (blues), temperate (purple), and sub-tropical (green) – clearly stand out from one another to form four general trends. When we examined the 10 remaining species, we found not only that the relative timing of events was constant across temperature within a species, as observed in D. melanogaster, but that landmarks occurred at the same relative time between species at all non-stressful temperatures (Figures 6, Table 4).
Fig. 6. Proportionality of developmental stages is not affected by non-heat-stress temperatures. 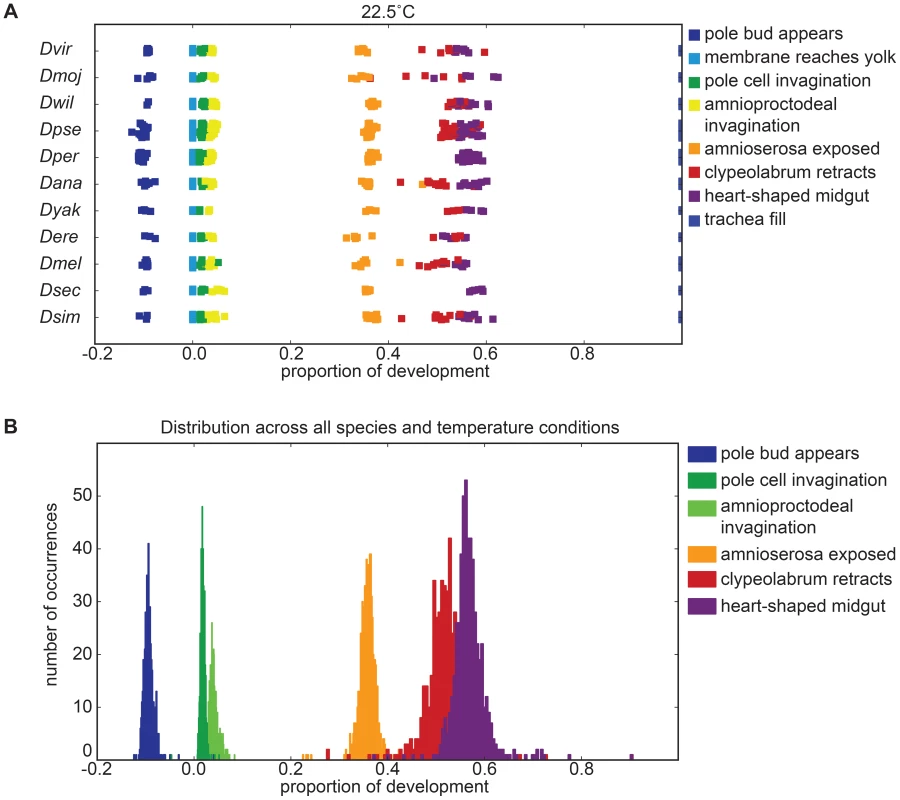
(A) Across species, development maintains the same proportionality. D. pseudoobscura stands out as not being co-linear at higher temperatures. Instead, the later part of its development is slowed and takes up a disproportionally long time. (B) Plotting proportionality across all species and all temperatures reveals the approximately normally distributed proportionality of all morphological stages. Tab. 4. The timing of specific developmental events can be predicted as a function of total developmental time. 
Developmental time is exponentially related to
Between 17.5°C and 27.5°C the total developmental time for all species can be approximated relatively accurately by an exponential regression (). For all species we find that temperature T can be related to developmental time , agreeing with a long history of temperature-dependent rate modeling [24]:
and developmental rate v: The parameters of these relations for each species, which includes two independent coefficients, are included in Table 5. Also included in Table 5 is the , an empirical description of biological rate change from a 10°C temperature change, for the 17.5°C to 27.5°C interval. At higher temperatures, heat stress appears to counter the logarithmic trend and lengthens developmental time. Since the temperature responses are highly reproducible, the developmental time for each species can be modeled and predictions made for future experiments (Figure S4).Tab. 5. The developmental time of embryos between 17.5°C and 27.5°C is a species-specific function of temperature. 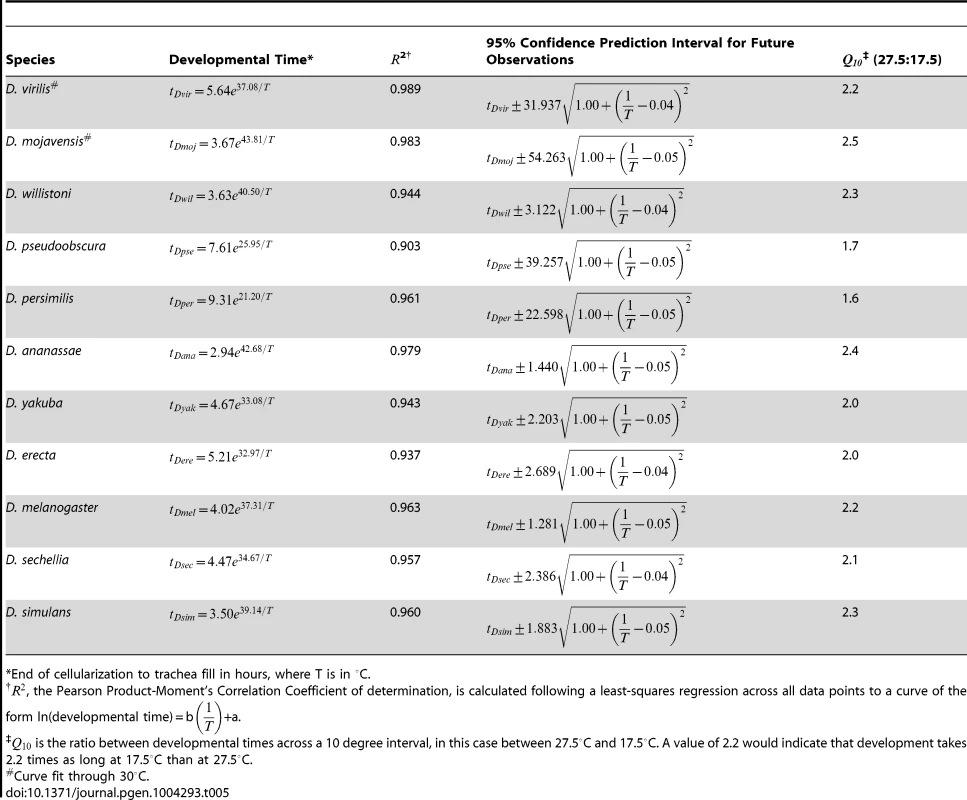
*End of cellularization to trachea fill in hours, where T is in °C. Effect of temperature on developmental rate is coupled to climatic origin
Seven of the eleven species we examined were of tropical origin, with only two alpine, one subtropical and one temperature species. At mid-range temperatures (22.5°C–27.5°C), the tropical species developed the fastest, followed by the subtropical D. mojavensis, the alpine D. pseudoobscura and D. persimilis, and the temperate D. virilis (Figure 5), in accord with [18].
Some tropical species have expanded into temperature zones and a variety of wild strains have been collected from a variety of climates. We examined nine additional strains of D. melanogaster collected along the eastern United States [25], [26]. Though collected along a tropical to temperate cline and there was some variation between strains, no trends were seen (Figure S5A,B).
The tropical species all showed highly similar responses to temperature, even though they originate from different continents (Africa, Asia and South America) and are not closely related (five of the species are in the melanogaster subgroup, but D. ananassae and D. willistoni are highly diverged from both D. melanogaster and each other). Though they possess similar temperature-responses, these species possess significantly different and independent temperature response curves () and the differences are large enough to be relevant for precise developmental experiments. These cross-species differences tend to be, but are not necessarily, larger than those seen between D. melanogaster strains (Figure S5C). The embryogenesis rate for these species increases rapidly with temperature () before slowing down at and above 30°C (Figure S6A–F, http://www.youtube.com/watch?v=vy6L4fmWkso or “D. ananassae at 7 temperatures” in DOI:10.5061/dryad.s0p50). The two closely related alpine species (D. pseudoobscura and D. persimilis) match the embryogenesis rate of the tropical species at 17.5°C, but accelerate far less rapidly with increasing temperature (), especially at 25°C and above (Figure S6I,J, http://www.youtube.com/watch?v=sYi-FUXpv4Q or “D. pseudoobscura at 6 temperatures” in DOI:10.5061/dryad.s0p50). These species also show a sharp increase in embryogenesis rate and low viability above 27.5°C, consistent with their cooler habitat. The subtropical D. mojavensis (Figure S6H, http://www.youtube.com/watch?v=XWMs4oUx_mU or “D. mojavensis at 6 temperatures” in DOI:10.5061/dryad.s0p50) and temperate D. virilis (Figure S6G, http://www.youtube.com/watch?v=eyr4ckDb0kM or “D. virilis at 6 temperatures” in DOI:10.5061/dryad.s0p50) both develop very slowly at low temperature, but accelerate rapidly as temperature increases ( of and respectively). D. virilis remains the slowest species up to 30°C, while D. mojavensis is as fast as the tropical species at high temperatures. These species are both members of the virilis-repleta radiation and it remains to be seen if this growth response is characteristic of the group as a whole, independent of climate.
Effects of heat stress
Under heat-stress, the proportionality of development is disrupted in some embryos (Figure S7A). The effect is not uniform, as some embryos developed proportionally under heat-stress and others exhibited significant aberrations, largely focused in post-germband shortening stages. This can be most clearly seen in individuals of D. ananassae, D. mojavensis, D. persimilis, and D. pseudoobscura. We did not identify any particular stage as causing this delay, but rather it appears to reflect a uniform slowing of development.
Early heat shock significantly disrupts development enough to noticeably affect morphology in yolk contraction, cellularization, and gastrulation (Figure S7B). Syncytial animals are the most sensitive to heat-shock (Figure S7C). In D. melanogaster and several other species we observed a slight contraction of proportional developmental time between early development (pole bud appears) and the end of cellularization (membrane reaches yolk) under heat-stress (30°C, Figure S7D). While all later stages following cellularization maintain their proportionality even at very high temperatures, the pre-cellularization stages take proportionally less and less time. This indicates that at higher temperatures, some pre-cellularization kinetics scale independently of later stages, possibly leading to mortality as the temperature becomes more extreme.
Discussion
We have addressed the lack of good data on the progress of embryogenesis in different species and at different temperatures with a carefully collected and annoted series of time-lapse movies in 11 species at seven temperatures that span most of the viable range for Drosophila species. From a practical standpoint, the predictable response of each species to temperature, and the uniform scaling of events between species and temperature, provides a relatively simple answer to the question that motivated this study - to determine how to obtain matched samples for genomic studies: simply choose the range of stages to collect in one strain or species, and scale the collection and aging times appropriately. The fact that development scales uniformly over non-extreme temperatures would seem to give some leeway in the choice of temperature, so long as heat-stress is avoided, though it remains unclear how molecular processes are affected by temperature.
Uniform scaling and the timing of embryogenesis
In carrying out this survey, we were surprised to find that the relative timing of landmark events in Drosophila embryogenesis is constant across greater than three-fold changes in total time, spanning 15°C and over 100 million years of independent evolution. And the fact that the same holds true for 34 developmental landmarks at two temperatures in the zebrafish Danio rerio [27], (the only other species for which we were able to locate similar data), suggests that this phenomenon may have some generality. But why is this so?
Drosophila development involves a diverse set of cellular processes including proliferation, growth, apoptosis, migration, polarization, differentiation, and tissue formation. One might expect (we certainly did) these different processes to scale independently with temperature, much as different chemical reactions do, and as a result, different stages of embryogenesis or parts of the developing embryo would scale differentially with temperature. But this is not the case. The simplest explanation for this observation is that a single shared mechanism controls timing across embryogenesis throughout the genus Drosophila. But what could such a mechanism be? One possibility is that there is an actual clock — some molecule or set of molecules whose abundance or activity progresses in a clocklike manner across embryogenesis and is read out to trigger the myriad different processes that occur in the transition from a fertilized egg to a larvae. However there is no direct evidence that such a clock exists (although we note that there is a pulse of ecdysone during embryogenesis with possible morphological functions [28], [29]). A more likely explanation is that there is a common rate limiting process throughout embryogenesis. Our data are largely silent on what this could be, but we know from other experiments that it is cell, or at least locally, autonomous [30]–[32] and would have to limit processes like migration that do not require cell division (we also note that cell division has been excluded as a possibility in zebrafish [32]). However, energy production, yolk utilization, transcription or protein synthesis are reasonable possibilities.
Although there are very few comparisons of the relative timing of events during development, it has long been noted that various measurements of developmental timing scale exponentially with [1], [5], [6], [24], [33], but no good explanation for this phenomenon has been uncovered. Perhaps development is more generally limited by something that scales exponentially with , like metabolic rate, which, we note, has been implicated numerous times in lifespan, which is, in some ways, a measure of developmental timing.
Gillooly and co-workers, noting the there was a relationship between metabolic rate, temperature and animal size, have proposed a model that incorporates mass into the Arrhenius equation to explain the relationship between these factors in species from across the tree of life [34], [35]. We, however, do not find that mass can explain the differences in temperature-dependence between species. Even closely-related species, with nearly 2-fold differences in their mass (e.g. D. melanogaster, D. simulans, D. sechellia, D. yakuba, and D. erecta), have significant divergence in their proportionality coefficients that do not converge at all when correcting for differences in mass through the one quarter power scaling proposed by Gillooly, et al. This suggests that some other factor is responsible for the differences, as has been argued by other groups [18], [36], [37]. The relationship between climate and temperature response raises the possibility that whatever this factor is has been subject to selection to tune the temperature response to each species' climate. However, without additional data this is purely a hypothesis.
Although a common rate-limiting step is simplest explanation for uniform scaling, it is certainly not the only one. It is possible that different rate limiting steps or other processes control developmental velocity at different times or in different parts of the embryo, and that they scale identically with temperature either coincidentally, or as the result of selection (it is important to remember that, as per Arrhenius, one does not expect different reactions to scale identically with temperature). If this is the result of selection, what is the selection pressure? Evolutionary developmental biologists, perhaps most notably Stephen J. Gould, have long written about how changes in either the absolute or relative timing of different events during development have had significant effects on morphology throughout animal evolution [38]–[41]. Perhaps this is also true for fly embryogenesis, but that any such changes in morphology are selectively disadvantageous and have been strongly selected against. It is also likely that many developing fly embryos experience significant changes in temperature while developing, so there may be strong selection to maintain uniform development across temperature to ensure normal progression while the temperature is changing.
Finally, we note that there are limits to this uniformity. At extreme temperatures, especially high ones, things no longer scale uniformly, likely reflecting the differential negative effects of high temperature at different stages of embryogenesis as well as the differential ability of the embryo to compensate for them. There are also clearly checkpoints in place that, while not triggered during normal embryogenesis, are important in extreme or unusual circumstances. Most strikingly, when Lucchetta et al. and Niemuth et al. examined embryos developing in chambers that allowed for independent temperature control of the anterior and posterior portions of the embryo, the two parts of the embryo developed at different velocities for much of embryogenesis [30], [31]. They found that embryos are robust to asynchrony in timing across the embryo, though there are critical periods that, once passed, do not permit re-synchronization of development [30], hinting at some specific checkpoints or feedback.
Climate and the rate of embryogenesis
The clustering of developmental timing and its temperature response with climate — especially amongst tropical species from different continents and parts of the Drosophila tree — suggests that this is an adaptive, or in some cases permissive, phenotype, although with only 11 species and poor coverage of non-tropical species this has to remain highly speculative. There are necessarily additional components to the temperature response, as significant variation exists within the tropical species and between D. melanogaster strains. The virilis-repleta radiation, which includes both D. virilis and D. mojavensis may have a climate-independent adaptation that leads to slowed development at cooler temperatures, a feature that is hard to rationalize. The poor response of the alpine D. pseudoobscura and D. persimilis to high temperature is consistent with their cool climate. Nevertheless, little is known about when and where most of these species lay their eggs and their natural microclimates.
The clustering of developmental responses in species by their native climates rather than their climates of collection suggests that if climate adaptation is a contributing factor, the response arises slowly or rarely. The tested strains of D. melanogaster were collected in temperate, subtropical, and tropical climates and the D. simulans strain was collected in a sub-tropical climate. Nevertheless, both species performed qualitatively like other tropical species and unlike native species collected nearby. This suggests that temperature responses are neither rapidly evolving (with D. melanogaster being present in the temperate United States for over 130 years [42]) nor primed for change in tropical species.
Materials and Methods
Rearing of Drosophila
Drosophila strains were reared and maintained on standard fly media at 25°C, except for D. persimilis and D. pseudoobscura which were reared and maintained at 22°C. D. melanogaster lines were raised at 18°C and 22°C for several years and their temperature response profiles were observed, verifying that transferring embryos from the ambient growth temperature for a line to the experimental temperature did not lead to heat-shock responses and had relatively little impact on the temperature response (Figure S8A,B). Egg-lays were performed in medium cages on 10 cm molasses plates for 1 hour at 25°C after pre-clearing for all species except D. persimilis, which layed at 22°C. Comparisons to D. melanogaster raised and laying at 22°C confirmed that growth at lower temperatures does not account for all of the differences between the tropical and alpine species (Figure S8C).To encourage egg-lay, cornmeal food media was added to plates for D. sechellia and pickled cactus was added to plates for D. mojavensis. Embryos were collected and dechorionated with fresh 50% bleach solution (3% hypochlorite final) for 45 to 90 seconds (based on the species) in preparation for imaging. Dechorionation timing was selected as the time it took for 90% of the eggs to be successfully dechorionated. This prevented excess bleaching, as many species, such as D. mojavensis, are more sensitive than D. melanogaster. Strains used were D. melanogaster, OreR, DGRP R303, DGRP R324, DGRP R379, DGRP R380, DGRP R437, DGRP R705, Schmidt Ln6-3, Schmidt 12BME10-24, and Schmidt 13FSP11-5; D. pseudoobscura, 14011-0121.94, MV2-25; D. virilis, 15010-1051.87, McAllister V46; D. yakuba, 14021-0261.01, Begun Tai18E2; D. persimilis, 14011-0111.49,(Machado) MSH3; D. simulans, 14021-0251.195, (Begun) simw501; D. erecta, 14021-0224.01, (TSC); D. mojavensis wrigleyi, 15081-1352.22, (Reed) CI 12 IB-4 g8; D. sechellia, 14021-0248.25, (Jones) Robertson 3C; D. willistoni, 14030-0811.24, Powell Gd-H4-1; D. ananassae, 14024-0371.13, Matsuda (AABBg1).
Time-lapse imaging
Embryos were placed on oxygen-permeable film (lumox, Greiner Bio-one), affixed with dried heptane glue and then covered with Halocarbon 700 oil (Sigma) [43]. The lumox film was suspended on a copper plate that was temperature-regulated with two peltier plates controlled by an H-bridge temperature controller (McShane Inc., 5R7-570) with a thermistor feedback, accurate to 0.1°C. Time-lapse imaging with bright field transmitted light was performed on a Leica M205 FA dissecting microscope with a Leica DFC310 FX camera using the Leica Advanced Imaging Software (LAS AF) platform. Greyscale images were saved from pre-cellularization to hatch. Images were saved every one to five minutes, depending on the temperature. A humidifier was used to mitigate fluctuations in ambient humidity, though fluctuations did not affect developmental rate. Due to fluctuations in ambient temperature and humidity, the focal plane through the halocarbon oil varied significantly. Therefore, z-stacks were generated for each time-lapse and the most in-focus plane at each time was computationally determined for each image using an algorithm (implemented in Matlab) through image autocorrelation [44], [45]. Time-lapse videos available from Dryad Digital Repository: doi:10.5061/dryad.s0p50.
Event estimation
A subset of time-lapses in D. melanogaster were analyzed to obtain a series of representative images for each of the 36 morphological events, selected as all events defined by [19], [46] that were reproducibly identifiable under our conditions, described. These images were sorted based on embryo orientation and superimposed to generate composite reference images. Images from each time-lapse to be analyzed were manually screened to determine the time when the membrane reaches the yolk, the time of trachea filling, and the orientation of the embryo (Figure S3. This information was fed into a Matlab script, along with the time-lapse images and the set of 34 composite reference images, to estimate the time of 34 morphological events during embryogenesis via image correlation. The same D. melanogaster reference images were used for all species for consistency. A correlation score was generated for each frame of the time-lapse. The running score was then smoothed (Savitzky-Golay smoothing filter) and the expected time window was analyzed for local maxima. The error in event calling for the computer is very large (greater than what we see for the overall spread across individuals of a single species at a given temperature), necessitating manual verification or correction of events. Many of these errors are due to aberrations in the image that confuse the computer but would not confuse a person. This results in a few bad images having a very negative effect of the overall accuracy of the computer analysis, but permits a significant improvement with just a little user input. The error in manual calls is very small compared to the variation between individuals. Computer-aided estimates were individually verified or corrected using a python GUI for all included data.
Statistical analysis
Statistical significance of event timing was determined by t-test with Bonferonni multiple testing corrections. Median correction to remove outliers was used in determining the mean and standard deviation of each developmental event. Least-squares fitting was used to determine the linear approximation of log-corrected developmental time for each species. Python and Matlab scripts used in the data analysis are available at github.com/sgkuntz/TimeLapseCode.git.
Supporting Information
Zdroje
1. PowsnerL (1935) The effects of temperature on the durations of the developmental stages of drosophila melanogaster. Physiological Zoology 8 : 474–520.
2. JamesAC, AzevedoRB, PartridgeL (1995) Cellular basis and developmental timing in a size cline of Drosophila melanogaster. Genetics 140 : 659–666.
3. JamesAC, AzevedoRB, PartridgeL (1997) Genetic and environmental responses to temperature of Drosophila melanogaster from a latitudinal cline. Genetics 146 : 881–890.
4. YamamotoA, OhbaS (1982) Strategic differences in thermal adaptation between two drosophila species, d. virilis and d. immigrans. Oecologia 52 : 333–339.
5. LillieFR, KnowltonFP (1897) On the effect of temperature on the development of animals. Zoological Bulletin 1 : 179–193.
6. LoebJ, NorthropJH (1916) Is there a temperature coefficient for the duration of life? PNAS 2 : 456–7.
7. PartridgeL, BarrieB, FowlerK, FrenchV (1994) Evolution and development of body and cell size in drosophila melanogaster in response to temperature. Evolution 48 : 1269–1276.
8. KimJ, KerrJQ, MinGS (2000) Molecular heterochrony in the early development of Drosophila. Proceedings of the National Academy of Sciences of the United States of America 97 : 212–216.
9. TantawyAO (1963) Effects of temperature and x-ray irradiation on intrinsic growth rate in populations of drosophila pseudoobscura. Genetica 34 : 34–45.
10. StratamanR, MarkowTA (1998) Resistance to thermal stress in desert drosophila. Functional Ecology 12 : 965–970.
11. MorinJ, MoreteauB, PétavyG, ParkashR, DavidJ (1997) Reaction norms of morphometrical traits in drosophila: adaptive shape changes in a stenotherm circumtropical species. Evolution 51 : 1140–1148.
12. Montchamp-MoreauC (1983) Interspecific competition between drosophila melanogaster and drosophila simulans: temperature effect on competitive ability and fitness components. Genet Sel Evol 15 : 367–78.
13. HoffmannAA, HallasR, SinclairC, MitrovskiP (2001) Levels of variation in stress resistance in drosophila among strains, local populations, and geographic regions: patterns for desiccation, starvation, cold resistance, and associated traits. Evolution; international journal of organic evolution 55 : 1621–1630.
14. HoffmannAA, WeeksAR (2007) Climatic selection on genes and traits after a 100 year-old invasion: a critical look at the temperate-tropical clines in Drosophila melanogaster from eastern Australia. Genetica 129 : 133–147.
15. RakoL, BlacketMJ, MckechnieSW, HoffmannAA (2007) Candidate genes and thermal phenotypes: identifying ecologically important genetic variation for thermotolerance in the Australian Drosophila melanogaster cline. Molecular Ecology 16 : 2948–2957.
16. GibertP, De JongG (2001) Temperature dependence of development rate and adult size in drosophila species: biophysical parameters. Journal of Evolutionary Biology 14 : 267–276.
17. Markow TA, O'Grady PM (2005) Drosophila: A Guide to Species Identification and Use. Academic Press.
18. MarkowTA, BeallS, MatzkinLM (2009) Egg size, embryonic development time and ovoviviparity in drosophila species. Journal of Evolutionary Biology 22 : 430–434.
19. Campos-Ortega J, Hartenstein V (1985) The embryonic development of Drosophila melanogaster. Berlin, New York: Springer-Verlag.
20. Foe VE, Odell GM, Edgar BA (1993), chapter 3: Mitosis and Morphogenesis in the Drosophila Embryo. In: The Development of Drosophila melanogaster. Cold Spring Harbor Press. Chapter 3: pp. 149–300.
21. Drosophila 12 Genomes Consortium (2007) ClarkA, EisenM, SmithD, BergmanC, et al. (2007) Evolution of genes and genomes on the drosophila phylogeny. Nature 450 : 203–218.
22. FoeVE, AlbertsBM (1983) Studies of nuclear and cytoplasmic behaviour during the five mitotic cycles that precede gastrulation in Drosophila embryogenesis. Journal of Cell Science 61 : 31–70.
23. KamZ, MindenJS, AgardDA, SedatJW, LeptinM (1991) Drosophila gastrulation: analysis of cell shape changes in living embryos by three-dimensional fluorescence microscopy. Development (Cambridge, England) 112 : 365–370.
24. Arrhenius S (1915) Quantitative laws in biological chemistry. G. Bell and sons, ltd.
25. MackayTFC, RichardsS, StoneEA, BarbadillaA, AyrolesJF, et al. (2012) The Drosophila melanogaster Genetic Reference Panel. Nature 482 : 173–178.
26. FabianD, KapunM, NolteV, KoflerR, SchmidtP, et al. (2012) Genome-wide patterns of latitudinal differentiation among populations of drosophila melanogaster from north america. Molecular Ecology 21 : 4748–4769.
27. KimmelCB, BallardWW, KimmelSR, UllmannB, SchillingTF (1995) Stages of embryonic development of the zebrafish. Developmental Dynamics 203 : 253–310.
28. Riddiford LM (1993) Hormones and drosophila development. In: Bate M, Martinez Arias A, editors. The Development of Drosophila melanogaster volume II. Cold Spring Harbor Press. pp. 899–939.
29. ChávezVM, MarquésG, DelbecqueJP, KobayashiK, HollingsworthM, et al. (2000) The drosophila disembodied gene controls late embryonic morphogenesis and codes for a cytochrome p450 enzyme that regulates embryonic ecdysone levels. Development 127 : 4115–4126.
30. LucchettaEM, LeeJH, FuLA, PatelNH, IsmagilovRF (2005) Dynamics of Drosophila embryonic patterning network perturbed in space and time using microfluidics. Nature 434 : 1134–1138.
31. NiemuthJ, WolfR (1995) Developmental asynchrony caused by steep temperature gradients does not impair pattern formation in the wasp, pimpla turionellae l. Roux's Arch Dev Biol 204 : 444–452.
32. GirdlerGC, ArayaC, RenX, ClarkeJDW (2013) Developmental time rather than local environment regulates the schedule of epithelial polarization in the zebrafish neural rod. Neural Development 8 : 5.
33. DavidsonJ (1944) On the relationship between temperature and rate of development of insects at constant temperatures. Journal of Animal Ecology 13 : 26–38.
34. GilloolyJF, BrownJH, WestGB, SavageVM, CharnovEL (2001) Effects of size and temperature on metabolic rate. Science 293 : 2248–2251.
35. GilloolyJF, CharnovEL, WestGB, SavageVM, HBJ (2002) Effects of size and temperature on developmental time. Nature 417 : 70–73.
36. ClarkeA (2004) Is there a universal temperature dependence of metabolism? Functional Ecology 18 : 252–256.
37. ClarkeA, FraserKPP (2004) Why does metabolism scale with temperature? Functional Ecology 18 : 243–251.
38. McNamaraKJ (1982) Heterochrony and phylogenetic trends. Paleobiology 8 : 130–142.
39. JonesDS, GouldSJ (1999) Direct measurement of age in fossil gryphaea: the solution to a classic problem in heterochrony. Paleobiology 25 : 158–187.
40. FélixMA, HillRJ, SchwarzH, SternbergPW, SudhausW, et al. (1999) Pristionchus pacificus, a nematode with only three juvenile stages, displays major heterochronic changes relative to caenorhabditis elegans. Proceedings Biological sciences/The Royal Society 266 : 1617–1621.
41. PatelNH, CondronBG, ZinnK (1994) Pair-rule expression patterns of even-skipped are found in both short - and long-germ beetles. Nature 367 : 429–434.
42. KellerA (2007) Drosophila melanogaster's history as a human commensal. Current Biology 17: R77–R81.
43. TechnauGM (1986) Lineage analysis of transplanted individual cell in embryos of drosophila melanogaster. i. the method. Roux's Arch Dev Biol 195 : 389–398.
44. SantosA, Ortiz de SolórzanoC, VaqueroJJ, PeñaJM, MalpicaN, et al. (1997) Evaluation of autofocus functions in molecular cytogenetic analysis. Journal of microscopy 188 : 264–72.
45. VollathD (1988) The influence of the scene parameters and of noise on the behaviour of automatic focusing algorithms. Journal of microscopy 151 : 133–146.
46. BownesM (1975) A photographic study of development in the living embryo. J Embryol exp Morph 33 : 789–801.
47. LachaiseD, SilvainJF (2004) How two Afrotropical endemics made two cosmopolitan human commensals: the Drosophila melanogaster-D. simulans palaeogeographic riddle. Genetica 120 : 17–39.
48. Patterson JT, Stone WS (1952) Evolution in the genus Drosophila. New York: Macmillan, 1 edition.
49. GranzottoA, LopesF, LeratE, VieiraC, CararetoC (2009) The evolutionary dynamics of helena retrotransposon revealed by sequenced drosophila genomes. BMC Evolutionary Biology 9 : 174.
Štítky
Genetika Reprodukčná medicína
Článok vyšiel v časopisePLOS Genetics
Najčítanejšie tento týždeň
2014 Číslo 4- Gynekologové a odborníci na reprodukční medicínu se sejdou na prvním virtuálním summitu
- Je „freeze-all“ pro všechny? Odborníci na fertilitu diskutovali na virtuálním summitu
-
Všetky články tohto čísla
- The Challenges of Mitochondrial Replacement
- Concocting Cholinergy
- Genome-Wide Diet-Gene Interaction Analyses for Risk of Colorectal Cancer
- Statistical Power to Detect Genetic (Co)Variance of Complex Traits Using SNP Data in Unrelated Samples
- Mouse Pulmonary Adenoma Susceptibility 1 Locus Is an Expression QTL Modulating -4A
- Transcription-Associated R-Loop Formation across the Human CGG-Repeat Region
- Epigenetic Regulation by Heritable RNA
- Protein Quantitative Trait Loci Identify Novel Candidates Modulating Cellular Response to Chemotherapy
- Genome-Wide Profiling of Yeast DNA:RNA Hybrid Prone Sites with DRIP-Chip
- The Mechanism of Gene Targeting in Human Somatic Cells
- A LINE-1 Insertion in DLX6 Is Responsible for Cleft Palate and Mandibular Abnormalities in a Canine Model of Pierre Robin Sequence
- Interaction between Two Timing MicroRNAs Controls Trichome Distribution in
- DNA Glycosylases Involved in Base Excision Repair May Be Associated with Cancer Risk in and Mutation Carriers
- The Myc-Mondo/Mad Complexes Integrate Diverse Longevity Signals
- Evolutionarily Diverged Regulation of X-chromosomal Genes as a Primal Event in Mouse Reproductive Isolation
- Mutations in Conserved Residues of the microRNA Argonaute ALG-1 Identify Separable Functions in ALG-1 miRISC Loading and Target Repression
- Genetic Predisposition to In Situ and Invasive Lobular Carcinoma of the Breast
- Isl1 Directly Controls a Cholinergic Neuronal Identity in the Developing Forebrain and Spinal Cord by Forming Cell Type-Specific Complexes
- A Synthetic Community Approach Reveals Plant Genotypes Affecting the Phyllosphere Microbiota
- The Sequence-Specific Transcription Factor c-Jun Targets Cockayne Syndrome Protein B to Regulate Transcription and Chromatin Structure
- Determining the Control Circuitry of Redox Metabolism at the Genome-Scale
- DNA Repair Pathway Selection Caused by Defects in , , and Telomere Addition Generates Specific Chromosomal Rearrangement Signatures
- Methylome Diversification through Changes in DNA Methyltransferase Sequence Specificity
- Folliculin Regulates Ampk-Dependent Autophagy and Metabolic Stress Survival
- Fine Mapping of Dominant -Linked Incompatibility Alleles in Hybrids
- Unexpected Role of the Steroid-Deficiency Protein Ecdysoneless in Pre-mRNA Splicing
- Three Groups of Transposable Elements with Contrasting Copy Number Dynamics and Host Responses in the Maize ( ssp. ) Genome
- Sox5 Functions as a Fate Switch in Medaka Pigment Cell Development
- Synergistic Interactions between the Molecular and Neuronal Circadian Networks Drive Robust Behavioral Circadian Rhythms in
- Chromatin Landscapes of Retroviral and Transposon Integration Profiles
- Widespread Use of Non-productive Alternative Splice Sites in
- Ras GTPase-Like Protein MglA, a Controller of Bacterial Social-Motility in Myxobacteria, Has Evolved to Control Bacterial Predation by
- Cell Type-Specific Functions of Genes Revealed by Novel Adipocyte and Hepatocyte Circadian Clock Models
- Phenotype Ontologies and Cross-Species Analysis for Translational Research
- Embryogenesis Scales Uniformly across Temperature in Developmentally Diverse Species
- In Pursuit of the Gene: An Interview with James Schwartz
- Molecular Mechanisms of Hypoxic Responses via Unique Roles of Ras1, Cdc24 and Ptp3 in a Human Fungal Pathogen
- Analysis of the Genome and Transcriptome of var. Reveals Complex RNA Expression and Microevolution Leading to Virulence Attenuation
- Genotypic and Functional Impact of HIV-1 Adaptation to Its Host Population during the North American Epidemic
- RNA Editome in Rhesus Macaque Shaped by Purifying Selection
- Proper Actin Ring Formation and Septum Constriction Requires Coordinated Regulation of SIN and MOR Pathways through the Germinal Centre Kinase MST-1
- Interplay of the Serine/Threonine-Kinase StkP and the Paralogs DivIVA and GpsB in Pneumococcal Cell Elongation and Division
- A Quality Control Mechanism Coordinates Meiotic Prophase Events to Promote Crossover Assurance
- CNNM2 Mutations Cause Impaired Brain Development and Seizures in Patients with Hypomagnesemia
- The RNA-Binding Protein QKI Suppresses Cancer-Associated Aberrant Splicing
- Uncoupling Transcription from Covalent Histone Modification
- Rad51–Rad52 Mediated Maintenance of Centromeric Chromatin in
- FRA2A Is a CGG Repeat Expansion Associated with Silencing of
- A General Approach for Haplotype Phasing across the Full Spectrum of Relatedness
- A Novel Highly Divergent Protein Family Identified from a Viviparous Insect by RNA-seq Analysis: A Potential Target for Tsetse Fly-Specific Abortifacients
- A Central Role for in Regulation of Islet Function in Man
- PLOS Genetics
- Archív čísel
- Aktuálne číslo
- Informácie o časopise
Najčítanejšie v tomto čísle- The Sequence-Specific Transcription Factor c-Jun Targets Cockayne Syndrome Protein B to Regulate Transcription and Chromatin Structure
- The Mechanism of Gene Targeting in Human Somatic Cells
- Genetic Predisposition to In Situ and Invasive Lobular Carcinoma of the Breast
- Widespread Use of Non-productive Alternative Splice Sites in
Prihlásenie#ADS_BOTTOM_SCRIPTS#Zabudnuté hesloZadajte e-mailovú adresu, s ktorou ste vytvárali účet. Budú Vám na ňu zasielané informácie k nastaveniu nového hesla.
- Časopisy


