-
Články
- Časopisy
- Kurzy
- Témy
- Kongresy
- Videa
- Podcasty
CD160-Associated CD8 T-Cell Functional Impairment Is Independent of PD-1 Expression
T-cell immune response is regulated by a variety of molecules known as co-inhibitory receptors. The over expression of co-inhibitory receptors has been observed in several chronic viral infections such as HIV disease, and is found to be associated with severe T-cell dysfunction. Recent studies have demonstrated that the co-expression of several co-inhibitory receptors correlated with greater impairment of CD8 T cells. However, the relative contribution of individual co-inhibitory receptors to the regulation of T-cell functions remains unclear. In order to shed light on these issues, we have evaluated the influence of the expression of 3 major co-inhibitory receptors such as PD-1, 2B4 and CD160 on CD8 T-cell functions such as proliferation, cytokines production and expression of cytotoxic granules. We demonstrate that CD160-associated CD8 T-cell functional impairment is independent of PD-1 expression and that the blockade of CD160 signaling may partially restore CD8 T-cell functions.
Published in the journal: CD160-Associated CD8 T-Cell Functional Impairment Is Independent of PD-1 Expression. PLoS Pathog 10(9): e32767. doi:10.1371/journal.ppat.1004380
Category: Research Article
doi: https://doi.org/10.1371/journal.ppat.1004380Summary
T-cell immune response is regulated by a variety of molecules known as co-inhibitory receptors. The over expression of co-inhibitory receptors has been observed in several chronic viral infections such as HIV disease, and is found to be associated with severe T-cell dysfunction. Recent studies have demonstrated that the co-expression of several co-inhibitory receptors correlated with greater impairment of CD8 T cells. However, the relative contribution of individual co-inhibitory receptors to the regulation of T-cell functions remains unclear. In order to shed light on these issues, we have evaluated the influence of the expression of 3 major co-inhibitory receptors such as PD-1, 2B4 and CD160 on CD8 T-cell functions such as proliferation, cytokines production and expression of cytotoxic granules. We demonstrate that CD160-associated CD8 T-cell functional impairment is independent of PD-1 expression and that the blockade of CD160 signaling may partially restore CD8 T-cell functions.
Introduction
Co-stimulatory and co-inhibitory molecules play a major role in the regulation of antigen-specific T-cell responses [1]. Following T-cell receptor (TCR) engagement, activation or inhibition of T-cell responses depends upon the balance between stimulatory and inhibitory signals, on the type of molecules engaged or ligands involved and the availability of signaling molecules [2]–[4].
Co-stimulatory/co-inhibitory molecules are commonly divided into 4 families: 1) the B7 family including CD28, Cytotoxic T-lymphocyte associated protein-4 (CTLA-4), Programmed Death receptor-1 (PD-1), Inducible T-cell Costimulator (ICOS) and B - and T-lymphocyte attenuator (BTLA), 2) TNF-α receptor family including CD27, 3) the CD2/SLAM family, including Signaling Lymphocyte Activation Molecule (SLAM), 2B4 and CD48 and 4) the immunoglobulin (Ig) family including T-cell Immunoglobulin mucin-3 (TIM-3), lymphocyte Activation Gene-3 (LAG-3) and CD160 [5]–[10]. Each co-inhibitory/stimulatory molecule interacts with one or several receptors expressed by one or various cell types (reviewed in [2]).
During the past decade, many studies performed in mice and humans have underscored the role of co-inhibitory molecules in the functional impairment (also called “exhaustion”) of antigen-specific T cells during chronic viral infections such as human immunodeficiency virus-1 (HIV-1) or hepatitis C virus (HCV) [11]–[14]. In these virus chronic infections, the early functional impairment of T cells was marked by the loss of proliferation capacity likely resulting from reduced capacity to produce IL-2 and a deficient killing capacity of CD8 T cells. The ability to produce TNF-α was generally observed at an intermediate state of T-cell exhaustion while the loss of IFN-γ occurred in the advanced stage of T-cell exhaustion [15], [16].
Recent studies have demonstrated that HIV-specific CD8 T cells co-expressing several co-inhibitory molecules such as PD-1, CD160 and 2B4 were significantly more functionally impaired than CD8 T cells expressing only one co-inhibitory molecule [17]–[19]. However, the relative contribution of each co-inhibitory molecule has not yet been fully delineated.
In the present study, we evaluated the impact of the expression of co-inhibitory molecules such as 2B4, PD-1 and CD160 on CD8 T-cells specific to influenza (Flu), Epstein Barr virus (EBV) and cytomegalovirus (CMV). We demonstrated that CD160+ CD8 T cells had reduced proliferation capacity, IL-2 production and perforin expression regardless of PD-1 expression thus providing evidence that CD160-associated T-cell impairment is independent of PD-1.
Results
EBV and CMV-specific CD8 T cells express significantly higher levels of CD160 than Flu-specific CD8 T cells
The expression of PD-1, 2B4, and CD160 co-inhibitory molecules was assessed by multiparametric flow cytometry in CMV-, EBV - and Flu-specific CD8 T cells from 22 healthy individuals ex vivo using peptide-MHC class I multimer complexes (Table 1). The gating strategy defining the positivity of co-inhibitory molecule expression was set by fluorescence minus one (FMO) for all co-inhibitory molecules tested (Fig. S1). The use of 2B4, PD-1 and CD160 co-inhibitory molecules expression allowed the identification of 6 major CD8 T-cell populations i.e. 2B4+CD160+PD-1+, 2B4+CD160+PD-1−, 2B4+CD160−PD-1+, 2B4+CD160−PD-1−, 2B4−CD160−PD-1+ and 2B4−CD160−PD-1− CD8 T-cell populations. The 2B4−CD160+PD-1+ and 2B4−CD160+PD-1− CD8 T-cell populations are minor populations and represent less than 0.05% and 0.5% of virus-specific CD8 T cells, respectively, and were not included in the additional analyses shown below. Representative flow cytometry profiles and cumulative data (n = 30) showed that CMV and EBV-specific CD8 T cells expressed significantly higher levels of 2B4 (P = 0.0003 and P = 0.0015, respectively) and CD160 (P<0.0001 and P = 0.0022, respectively) as compared to Flu-specific CD8 T cells (Fig. 1A and B). Interestingly, no significant differences were observed in PD-1 expression between CMV, EBV and Flu-specific CD8 T cells in the cohort of subjects investigated in the present study (Fig. 1A and B). However, the proportion of 2B4+CD160+PD-1+ and 2B4+CD160+PD-1− cells were significantly higher in CMV and EBV-specific CD8 T cells than in Flu-specific CD8 T cells (P<0.025) (Fig. 1C). Of note, mean fluorescent intensity (MFI) of CD2B4, CD160 and PD-1 was not significantly different between FLU, EBV and CMV-specific CD8 T cells (Fig. S2). Flu-specific CD8 T cells were mainly composed of 2B4−CD160−PD-1−, 2B4−CD160−PD-1+ and 2B4+CD160−PD-1+ CD8 T-cell populations (Fig. 1C). Interestingly, the co-inhibitory molecule expression profile of CMV and EBV-specific CD8 T cells was heterogeneous but not significantly different (P>0.05).
Fig. 1. EBV and CMV-specific CD8 T cells express significantly more CD160 than Flu-specific CD8 T cells. 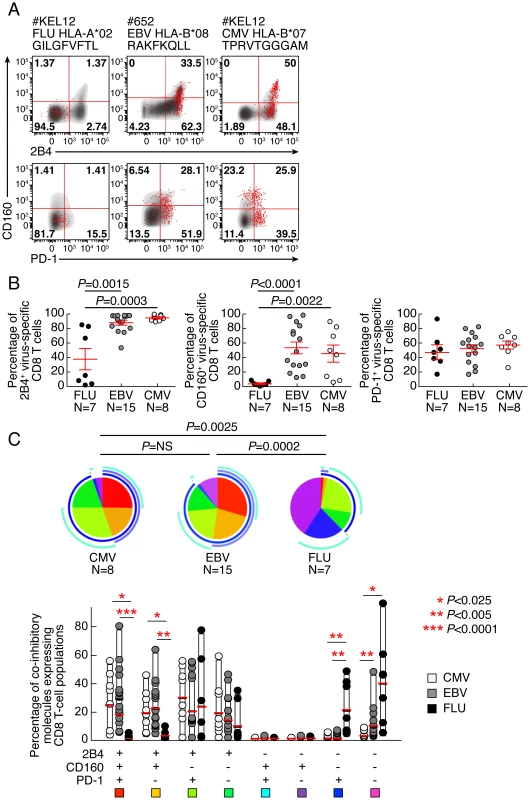
Flow cytometric profiles of Flu, EBV and CMV-specific CD8 T cells expressing PD-1, CD160 and 2B4 ex vivo. The expression profiles of CD8 T cells were performed in 22 individuals using polychromatic flow cytometry. (A) 2B4, CD160 and PD-1 expression profiles of Flu, EBV and CMV-specific CD8 T cells detected by multimer staining (red) as compared to total CD8 T cells (black/grey) of three representative individuals (#KEL12 FLU HLA-A*02 GILGFVFTL, #652 EBV HLA-B*08 RAKFKQLL and #KEL12 CMV HLA-B*07 TPRVTGGGAM, respectively). (B) Frequencies of Flu, EBV and CMV-specific CD8 T cells expressing 2B4, CD160, PD-1. Red bars correspond to mean ± SEM. Statistical significance (P values) in panel B were obtained using One-way ANOVA (Kruskal-Wallis test) followed by a unpaired Student's t-test. (C) Expression profiles of 2B4, CD160, PD-1 of CMV, EBV and Flu-specific CD8 T cells. All the possible combinations of 2B4, CD160 and PD-1 expression are shown on the x axis and frequencies of 2B4, CD160 and PD-1 expression on CD8 and T-cell populations are shown on the y axis. Combinations of expression are grouped and color-coded on the basis of the number of molecules expressed. The pie chart summarizes the data, and each slice corresponds to the fraction of T cells expressing a given combination of molecules within the CD8 T-cell populations. Bars correspond to the fractions of distinct T-cell populations within the total T cells. Stars indicate statistical significance (*:P<0.025; **:P<0,005; ***:P<0.0001) and were calculated using the SPICE software. Tab. 1. Sequences of peptides used for CD8 T-cell stimulations and multimer staining. 
CD160 but not PD-1 and/or 2B4 expression negatively correlates with CD8 T-cell proliferative capacity
As mentioned above, CD8 T-cell proliferation capacity is one of the first function lost during CD8 T-cell functional impairment [11]–[14], [20]. The proliferation capacity of Flu, EBV and CMV-specific CD8 T cells was then assessed using the CFSE flow cytometry assay. To normalize according to the initial frequency of virus-specific CD8 T cells, virus-specific CD8 T-cell proliferation capacity was represented in proliferation index, defined as the ratio of the virus-specific CD8 T-cell proliferation capacity (percentage of CFSE low CD8 T cells) and the ex vivo frequency of virus-specific CD8 T cells (measured by MHC class I multimer staining). The representative flow cytometry profiles and the cumulative data showed that the proliferation index of Flu-specific CD8 T cells was significantly higher than that of EBV and CMV-specific CD8 T cells (Fig. 2 A–E). We then evaluated the potential association between the ex vivo expression pattern of co-inhibitory molecules expression and the proliferation index of virus-specific CD8 T cells. We showed that the ex vivo proportion of CD160, 2B4 but not PD-1 inversely correlated with the proliferation index of virus-specific CD8 T cells (r = −0.7605; P<0.0001, r = −0.5248; P = 0.0049, and r = 0.1002; P = 0.6192, respectively) (Fig. S3). We then assessed whether certain combinations of co-inhibitory molecules expression would be specifically associated with the proliferation index of virus-specific CD8 T cells. We showed that the ex vivo proportion of 2B4+CD160+PD-1+ or 2B4+CD160+PD-1− virus-specific CD8 T cells inversely correlated with the proliferation index of virus-specific CD8 T cells (r = −0.72; P<0.0001 and r = −0.62; P = 0.0004, respectively) (Fig. 2F). In addition, the proliferation index of virus-specific CD8 T cells did not inversely correlate with the proportion of CD160− CD8 T-cell populations (Fig. 2F). These data suggest that the proliferation capacity of virus-specific CD8 T cells may be negatively regulated by CD160 expression independently of PD-1 expression.
Fig. 2. CD160, but not PD-1 and/or 2B4 expression inversely correlates with CD8 T-cell proliferative capacity. 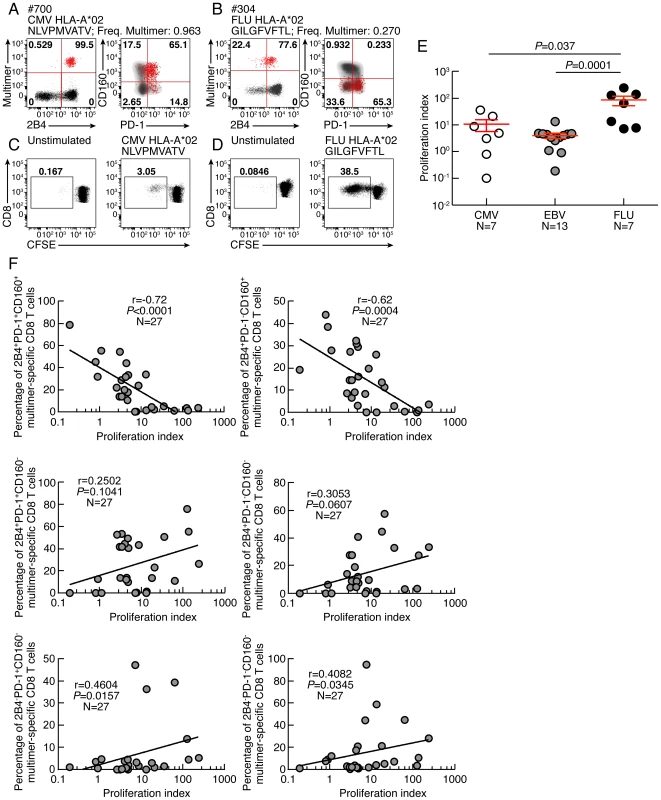
(A–B) Representative flow cytometric profiles of 2B4, PD-1 and CD160 expression of CMV (#700 CMV HLA-A*02 NLVPMVATV) and Flu (#304 FLU HLA-A*02 GILGFVFTL) specific CD8 T cells detected by multimer staining (red) as compared to total CD8 T cells (black/grey). (C–D) Representative CMV (#700 CMV HLA-A*02 NLVPMVATV) and Flu (#MP FLU HLA-A*02 GILGFVFTL) specific CD8 T-cell proliferation capacity assessed by CFSE based assay. (E) Proliferation index (CFSElow CD8 T-cell frequency/Multimer-specific CD8 T-cell frequency) CMV, EBV and FLU-specific CD8 T cells. Red bars correspond to mean ± SEM. (F) Correlations between proliferation index (CFSElow CD8 T-cell frequency/Multimer-specific CD8 T-cell frequency; x axes) and the virus-specific CD8 T-cell subsets distribution (percentage of Multimer-specific CD8 T cells expressing the different combinations of 2B4, PD1 and CD160; y axes). Statistical significance (P values) in panel E were obtained using One-way ANOVA (Kruskal-Wallis test) followed by a Student's t-test. P values in F were obtained using Spearman's rank correlations. Proliferative capacity virus-specific CD8 T-cell populations is influenced by co-inhibitory molecule expression
To determine the impact of co-inhibitory signals on virus-specific CD8 T-cell proliferation capacity, CD8 T-cell populations were sorted based on PD-1, 2B4 and CD160 expression. Of note, naïve CD8 T cells (CD45RA+CCR7+) were excluded from the analysis. Cell populations were then stimulated with (viral) peptides in the presence of antigen presenting cells (CD8-depleted PBMCs) for 6 days (Fig. 3). The proliferation capacity of Flu, EBV and CMV-specific CD8 T cells was then assessed using the CFSE flow cytometry assay and normalized according to the initial frequency of virus-specific CD8 T cells within each CD8 T-cell population (i.e. 2B4+CD160+PD-1+, 2B4+CD160+PD-1−, 2B4+CD160−PD-1+, 2B4+CD160−PD-1−, 2B4−CD160−PD-1+ and 2B4−CD160−PD-1− CD8 T-cell populations). The representative flow cytometric profiles as well as the cumulative data show that the proliferation capacity of virus-specific 2B4+CD160+PD-1+, 2B4+CD160+PD-1−, 2B4+CD160−PD-1+, 2B4+CD160−PD-1− CD8 T-cell populations was significantly reduced as compared to 2B4−CD160−PD-1+ and 2B4−CD160−PD-1− CD8 T-cell populations (P<0.05) (Fig. 3A–B). Of note, the proliferation capacity of 2B4+CD160−PD-1− and 2B4−CD160+PD-1+ CD8 T cells was not significantly different (P = 0.0628) (Fig. 3B). These data suggest that the proliferation capacity of virus-specific CD8 T cells is influenced by co-inhibitory molecule expression.
Fig. 3. Proliferative capacity virus-specific CD8 T-cell populations is influenced by co-inhibitory molecule expression. 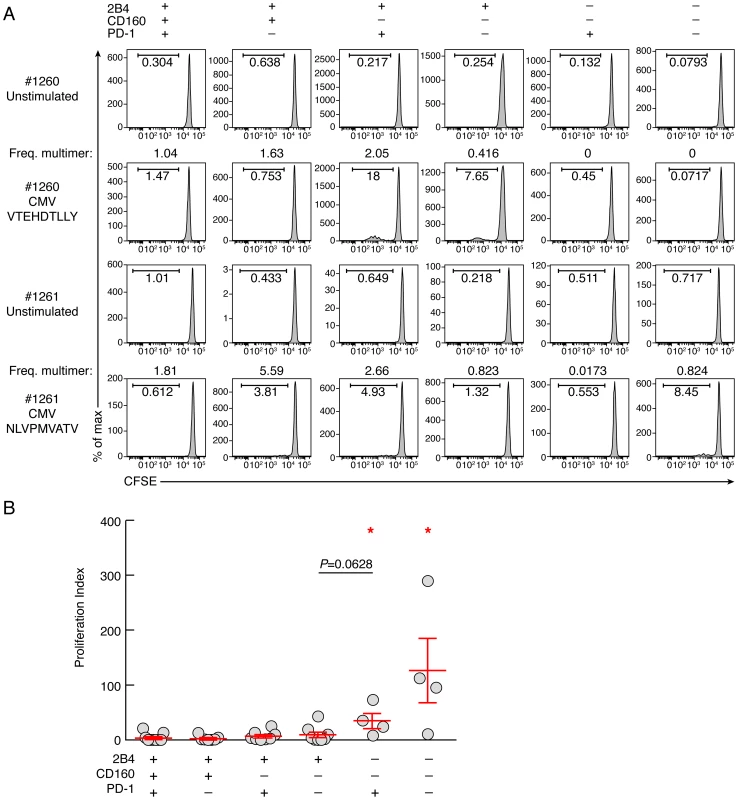
CD8 T-cell populations were sorted on the basis of 2B4, PD-1 and CD160 expression, labeled with CFSE and stimulated with (viral) peptides in the presence of autologous irradiated CD8-depleted PBMCs (ratio CD8/feeder cells 1∶10) for 6 days (n = 11). (A) Representative CMV (#1260 CMV HLA-A*01 VTEHDTLLY) and CMV (#1261 CMV HLA-A*02 NLVPMVATV) specific CD8 T-cell proliferation capacity assessed by CFSE based assay. (B) Proliferation index (CFSElow CD8 T-cell frequency/Multimer-specific CD8 T-cell frequency) of virus-specific CD8 T cells. Red bars correspond to mean ± SEM. Red stars indicate statistical significance (P<0.05). Statistical significance (P values) in panel B was obtained using One-way ANOVA (Kruskal-Wallis test) followed by a Student's t-test. CD8 T-cell populations expressing CD160 harbor reduced proliferative capacity, independently of PD-1 expression
To determine the intrinsic CD8 T-cell proliferation capacity, CD8 T-cell populations were sorted based on PD-1, 2B4 and CD160 expression. Of note, naïve CD8 T cells (CD45RA+CCR7+) were excluded from the analysis. Cell populations were then stimulated with coated anti-CD3 and anti-CD28 MAbs for 6 days, and the proliferation capacity was assessed using CFSE flow cytometry based assay (Fig. 4). The representative flow cytometric profiles and the cumulative data showed that the proliferation capacity of CD160 and/or PD-1-expressing CD8 T cells was significantly reduced as compared to CD160 and PD-1 negative CD8 T-cell populations (P<0.05) (Fig. 4). Interestingly, the proliferation capacity of 2B4+CD160+PD-1+ and 2B4+CD160+PD-1− CD8 T cells was not significantly different (P = 0.6786), suggesting that CD160-expessing CD8 T cells are endowed with reduced proliferation capacity, independently of PD-1 expression.
Fig. 4. Intrinsic proliferation capacity of sorted CD8 T-cell populations expressing the different combinations of 2B4, CD160 and PD-1. 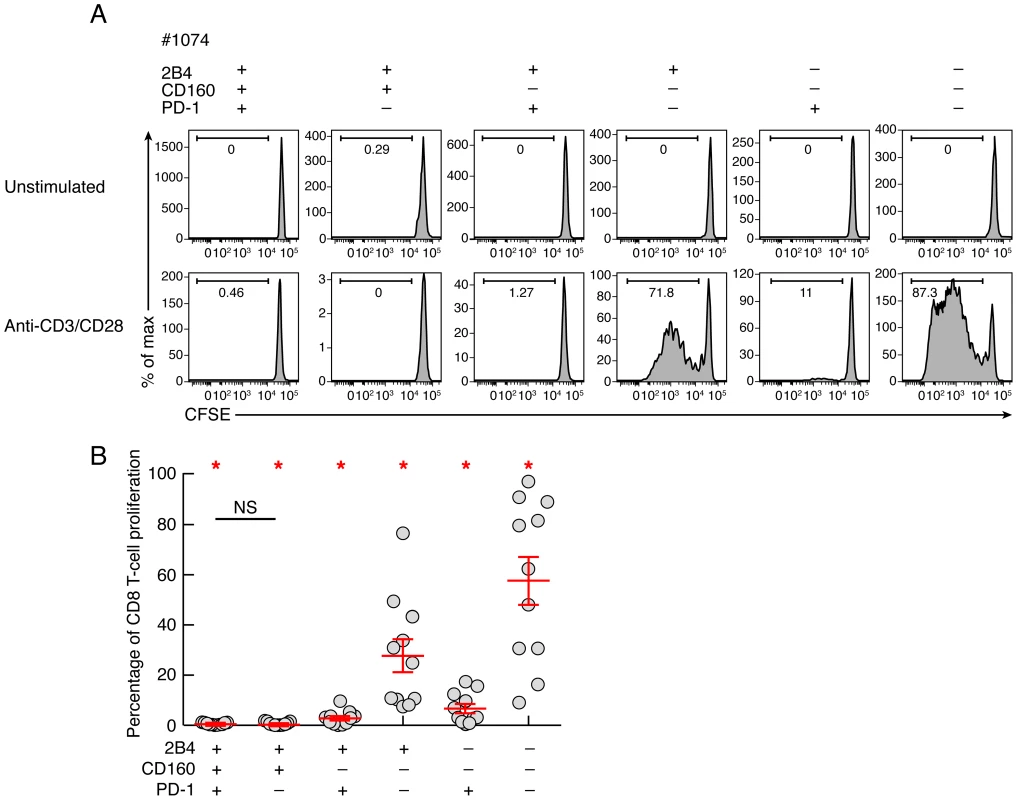
CD8 T-cell populations were sorted on the basis of 2B4, PD-1 and CD160 expression, labeled with CFSE and stimulated in anti-CD3 and anti-CD28 MAbs coated plate for 6 days (n = 11). The percentage of proliferating CD8 T cells (CFSE low) was assessed by flow cytometry at day 6. (A) Representative flow cytometric profiles of proliferating CD8 T-cell populations following anti-CD3/CD8 MAbs stimulation. Unstimulated cells (negative control) are also shown. (B) Percentage of CD8 T-cell proliferation of each CD8 T-cell subset upon 6 days stimulation with a-CD3/CD28 coated mAbs. Red bars correspond to mean ± SEM. Red stars indicate statistical significance (P<0.05). NS: not significant. Statistical significance (P values) in panels A and B were obtained using One-way ANOVA (Kruskal-Wallis test) followed by a paired Student's t-test. CD160 but not PD-1 expression is strongly associated with reduced IL-2 production
In chronic virus infections the loss of CD8 T-cell proliferative capacity is commonly associated with a progressive reduction of IL-2 production [15], [16]. Production of IFN-γ is affected generally at advanced stages of T-cell exhaustion [15], [16]. IL-2 and IFN-γ production were then evaluated by flow cytometry in memory CD8 T-cell populations defined by PD-1, 2B4 and CD160 expression. Of note, the naïve CD8 T-cell population (CD45RA+CCR7+) was excluded from this analysis. The representative flow cytometric profiles as well as the cumulative data showed that the frequencies of IL-2 and IFN-γ-producing cells were significantly reduced in CD160+ CD8 T-cell populations as compared to CD160− CD8 T-cell populations (P<0.05) (Fig. 5A–C). The frequencies of both IL-2 and IFN-γ-producing cells were not significantly different between 2B4+CD160+PD-1+ and 2B4+CD160+PD-1− CD8 T-cell populations (P = 0.998 and P = 0.470, respectively) and between 2B4+CD160−PD-1+ and 2B4+CD160−PD-1− CD8 T-cell populations (P = 0.888 and P = 0.908, respectively) (Fig. 5A–C). In addition, 2B4−CD160−PD-1+ CD8 T-cell populations contained higher frequencies of IL-2-producing cells than any other CD8 T-cell population (P<0.05) (Fig. 5A–C), demonstrating that CD160 and not PD-1 expression on memory CD8 T cells is strongly associated with reduced IL-2 and IFN-γ production capacity.
Fig. 5. Relative capacity of CD8 T-cell subsets defined by 2B4, CD160 and PD-1 expression to produce IL-2 and IFN-γ. 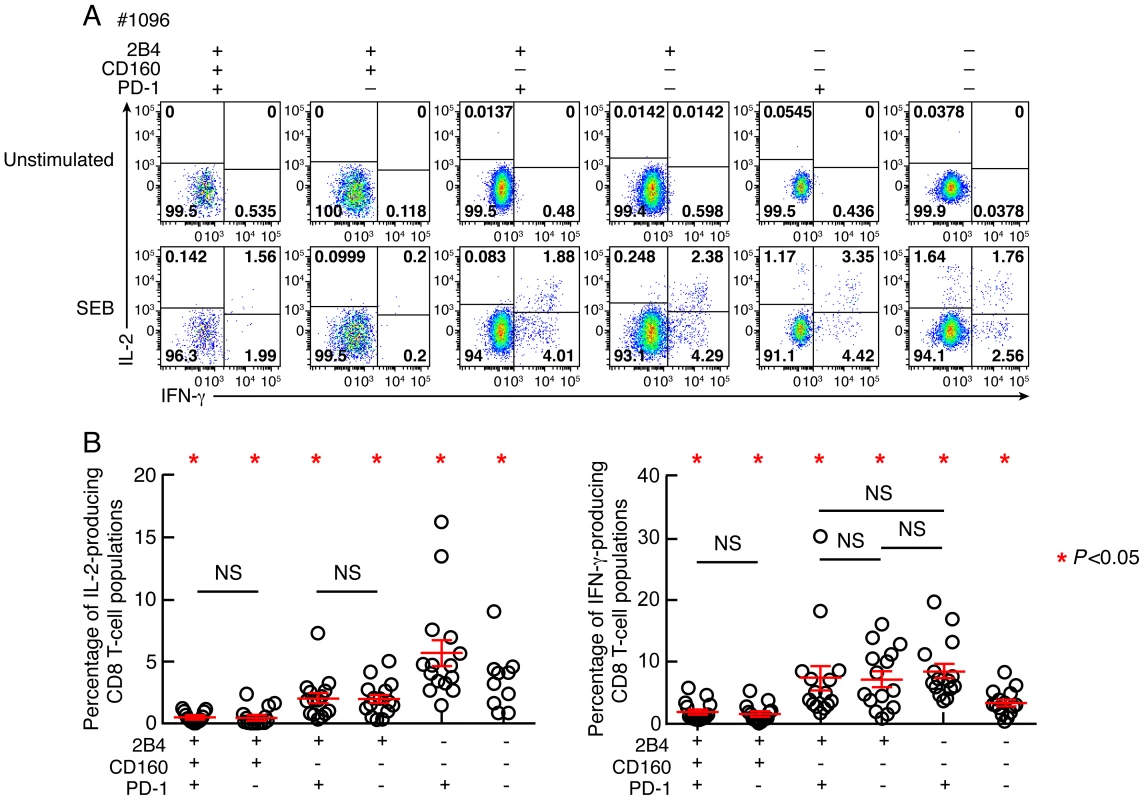
CD8 T-cell responses were analyzed within six CD8 T-cell subsets defined by 2B4, CD160 and/or PD-1 expression. (A) Representative flow cytometric profiles of CD8 T cells producing IL-2 and/or IFN-γ following stimulation of total blood mononuclear cells with SEB in Subject #1096. Unstimulated cells (negative control) are also shown. (B) Frequencies of IL-2 and IFN-γ-producing CD8 T-cell populations. Red bars correspond to mean ± SEM. Red stars indicate statistical significance (P<0.05). NS: not significant. Statistical significance (P values) in panels A and B were obtained using One-way ANOVA (Kruskal-Wallis test) followed by a paired Student's t-test. Co-inhibitory molecule expression is associated with the differentiation state
Reduced IL-2 production capacity is commonly associated with increased differentiation state [21]. In this context, we assessed the potential association between co-inhibitory molecule expression and differentiation state. To that purpose, the differentiation state was evaluated using the expression of CD45RA and CCR7. The representative flow cytometric profiles as well as the cumulative data showed that 2B4, CD160 and PD-1 expression significantly increased with the differentiation state, confirming the recent findings from Legat and colleagues [22] (Fig. 6A–B). However, in-depth analyses showed that CD8 T-cell populations defined by 2B4, CD160 and/or PD-1 expression were heterogeneously distributed among the distinct differentiated CD8 T-cell subsets (Fig. 6C). Indeed, the central memory compartment (CM; CD45RA−CCR7+) was significantly enriched in 2B4−CD160−PD-1− and 2B4−CD160−PD-1+ CD8 T-cell populations, the effector memory compartment (EM; CD45RA−CCR7−) was significantly enriched in PD-1+ CD8 T-cell populations (2B4+CD160+PD-1+, 2B4+CD160−PD-1+ and 2B4−CD160−PD-1+ CD8 T-cell populations) and the terminally differentiated effector memory compartment (TDEM; CD45RA+CCR7−) was significantly enriched in the 2B4+CD160+PD-1− CD8 T-cell population (P<0,05) (Fig. 6C). These data suggest that co-inhibitory molecule expression is associated with differentiation state. However in depth analyses further indicated that significant differences are present within each CD8 T-cell populations, particularly among PD-1 and/or CD160-expressing populations.
Fig. 6. Combined assessment of co-inhibitory molecule expression and differentiation state. 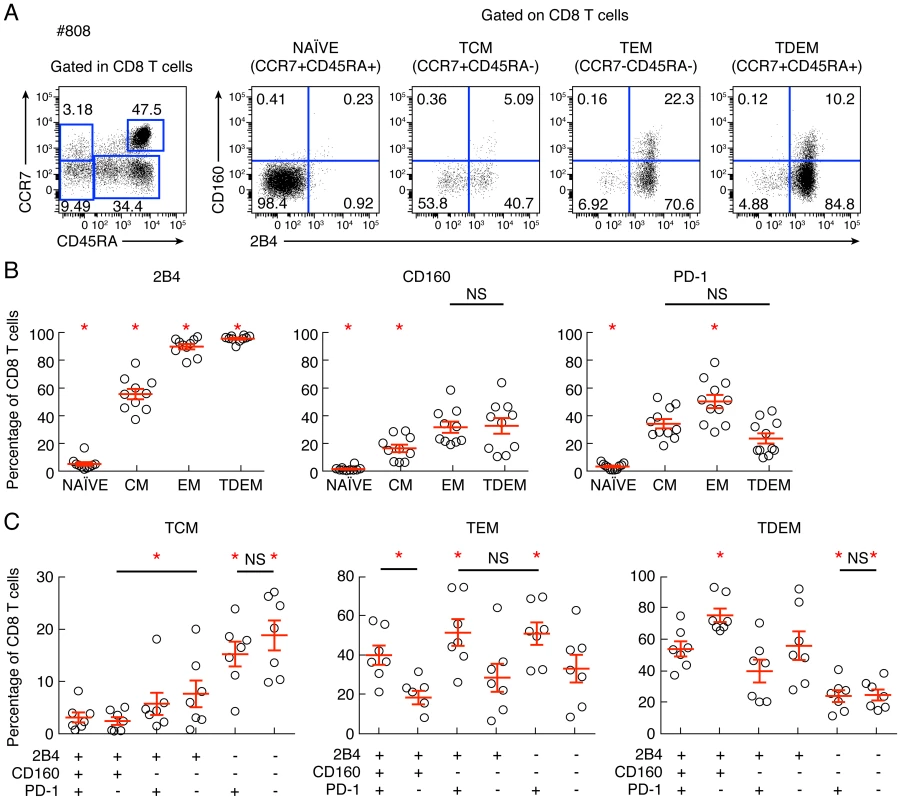
CD8 T-cell differentiation and CD8 T-cell expression of 2B4, CD160 and/or PD-1 were analyzed. (A) Representative example of flow cytometric profile of CD8 T-cell subsets defined by CCR7 and CD45RA expressing 2B4 and/or CD160. (B) Cumulative analyses (n = 10) of co-inhibitory molecules expression within 3 distinct memory CD8 T-cell subsets. (C) Cumulative analyses (n = 10) of the differentiation within 6 distinct CD8 T-cell population defined by 2B4, PD-1 and CD160 expression. NS: not significant. Statistical significance (P values) was obtained using One-way ANOVA (Kruskal-Wallis test) followed by a paired Student's t-test. Red bars correspond to mean ± SEM. Red stars indicate statistical significance (P<0.05). CD160 but not PD-1 expression is strongly associated with reduced perforin expression
Since perforin expression is the hallmark of differentiated CD8 T cells [21], we then assessed whether 2B4+CD160+PD-1+ and 2B4+CD160+PD-1− CD8 T-cell populations were enriched in perforin or granzyme B. Indeed, cytotoxic CD8 T cells exert their antiviral activity primarily through the secretion of cytotoxic granules containing perforin and granzymes [23], [24]. Therefore, the expression of perforin and granzyme B was evaluated in CD8 T-cell populations defined by the expression of PD-1, 2B4 and/or CD160. Of note, the naïve CD8 T-cell population (CD45RA+CCR7+) was excluded from this analysis. As shown in the representative flow cytometric profiles and the cumulative data perforin and granzyme B were significantly enriched in 2B4+ CD8 T-cell population as compared to 2B4− CD8 T-cell populations (P<0.05) (Fig. 7A–B) consistently with a previous study [25]. Within 2B4+ CD8 T-cell populations, perforin expression was not significantly different between 2B4+PD-1−CD160+ and 2B4+PD-1+CD160− CD8 T-cell populations (P = 0.1596). However, perforin expression was significantly reduced in 2B4+PD-1+CD160+, 2B4+PD-1−CD160+ and 2B4+PD-1+CD160− CD8 T-cell populations as compared to the 2B4+PD-1−CD160− CD8 T-cell population (P = 0.0014, P = 0.0047 and P = 0.0039, respectively). Interestingly, perforin expression was significantly reduced in 2B4+PD-1+CD160+ as compared to 2B4+PD-1−CD160+ and 2B4+PD-1+CD160− CD8 T-cell populations (P = 0.0092 and P = 0.0201, respectively). Finally, the potential association between perforin and co-inhibitory molecule expression was assessed within each differentiated CD8 T-cell subset i.e. naïve, central memory, effector memory and terminally differentiated effector memory. The representative flow cytometric profiles and the cumulative data showed that perforin expression was significantly enriched within 2B4-expressing CD8 T cells in both EM (P = 0.0011) and TDEM (P<0.0001) (Fig. 7C–D). Interestingly, perforin expression was significantly reduced in CD160-expressing CD8 T cells in both EM (P = 0.0063) and TDEM (P = 0.026) and in PD-1-expressing CD8 T cells in both EM (P = 0.0391) and TDEM (P = 0.00031) (Fig. 7C–D). Taken together, these data demonstrate that CD8 T-cell populations expressing CD160 and/or PD-1 harbored reduced perforin expression, independently of the differentiation state (Fig. 7C–D). Of note, the percentage of expression of EOMES, T-bet and CD57 (immunosenescence [26]) was not significantly different (P>0.05) between 2B4+CD160+PD-1− and 2B4+CD160+PD-1+ CD8 T-cell populations (Fig. S4), suggesting that 2B4+CD160+PD-1+ CD8 T-cell population was not more immunosenescent than 2B4+CD160+PD-1− CD8 T-cell population. Taken together, these data demonstrate that the expression of CD160 and/or PD-1 on 2B4+ CD8 T cells is associated with a reduced capacity to express perforin as compared to the 2B4+CD160−PD-1− CD8 T-cell population, independently on the differentiation state.
Fig. 7. Expression levels of perforin and granzyme B in CD8 T-cell subsets defined by the expression of 2B4, CD160 and PD-1. 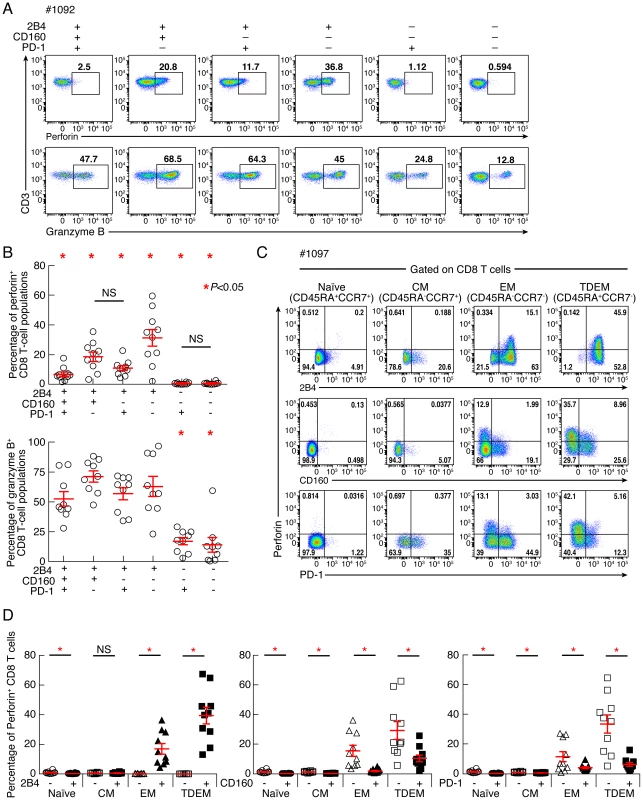
CD8 T-cell responses were analyzed within six CD8 T-cell subsets defined by 2B4, CD160 and/or PD-1 expression. (A) Representative flow cytometric profiles of CD8 T cells expressing perforin and/or granzyme B ex vivo. (B) Frequencies of CD8 T cells expressing perforin and granzyme B. (C) Representative flow cytometric profiles of differentiated CD8 T-cell subsets defined by the CCR7 and CD45RA expressing perforin, 2B4, CD160 and PD-1. (D) Cumulative analyses (n = 10) representing the expression of perforin differentiated CD8 T-cell subsets in function of CD160 expression. Red bars correspond to mean ± SEM. Red stars indicate statistical significance (P<0.05). NS: not significant. Statistical significance (P values) in panels B and D were obtained using One-way ANOVA (Kruskal-Wallis test) followed by a paired Student's t-test. CD160 blockade significantly increases virus-specific CD8 T-cell proliferation
In order to assess the relative influence of CD160 signaling as compared to PD-1 signaling on the virus-specific CD8 T-cell proliferation capacity, the proliferation capacity of CMV, EBV and Flu-specific CD8 T cells was evaluated in the presence or in the absence of 1) blocking anti-CD160 monoclonal antibodies (mAbs), 2) blocking anti-PD-L1/2 mAbs, 3) combined blocking anti-CD160 and anti-PD-L1/2 mAbs and 4) isotype controls. Of note, anti-CD160 MAbs did not show any agonistic potential either in absence or in presence of TCR signal (data not shown), as assessed by CD69, CD107a and BCL-2 expression or TNF-α and IFN-γ production (data not shown). The representative flow cytometric profiles showed that both anti-CD160 and anti-PD-1 mAb treatments individually increased the proliferation capacity of EBV-specific CD8 T cells (Fig. 8A). In addition, the cumulative data showed that both anti-CD160 and anti-PD-1 mAb treatments individually increased the proliferation capacity of CMV, EBV and Flu-specific CD8 T cells (2.06 fold increase; P<0.0001; and 7.6 fold increase; P<0.0001, respectively) (Fig. 8B–C). The effects of the combined blockade of CD160 and PD-1 signaling pathways as compared to PD-1 or CD160 signaling blockade alone on CD8 T-cell proliferation were assessed on virus-specific CD8 T-cell populations harboring 1) both 2B4+CD160−PD-1+ and 2B4+CD160+PD-1− CD8 T-cell populations (2B4+CD160−PD-1+ and 2B4+CD160+PD-1− virus-specific CD8 T cells >10%; N = 5) (Fig. 8D) and 2) containing the highest proportion of 2B4+CD160+PD-1+ CD8 T-cell population (2B4+CD160+PD-1+ virus-specific CD8 T cells >30%; N = 6) (Fig. 8E). The cumulative data show that the combined blockade of CD160 and PD-1 signaling pathways significantly increased CD8 T-cell proliferation as compared to PD-1 or CD160 signaling blockade alone, in virus-specific CD8 T cells containing both 2B4+CD160−PD-1+ and 2B4+CD160+PD-1− CD8 T-cell populations (2B4+CD160−PD-1+ and 2B4+CD160+PD-1− virus-specific CD8 T cells >10%; N = 5) (P<0.05) (Fig. 8D). However, consistently with the study by Peretz et al. [18], the combined blockade of CD160 and PD-1 signaling pathways did not significantly increase CD8 T-cell proliferation as compared to PD-1 signaling blockade alone, in virus-specific CD8 T cells containing the highest proportion of 2B4+CD160+PD-1+ CD8 T-cell population (2B4+CD160+PD-1+ virus-specific CD8 T cells >30%; N = 6) (P>0.05) (Fig. 8E). In addition, PD-1 signaling blockade was significantly more potent on virus-specific CD8 T cells with dominant 2B4−CD160−PD-1+ CD8 T-cell population as compared to virus-specific CD8 T cells with dominant 2B4+CD160−PD-1+ or 2B4+CD160+PD-1+ CD8 T-cell populations (10.36 versus 4.06 and 1.95 fold increase; P = 0.0014 and P = 0.0023, respectively) (Fig. 8F). Of note, PD-1 mean fluorescent intensity (MFI) was not significantly different between 2B4−CD160−PD-1+ and 2B4+CD160+PD-1+ CD8 T-cell populations (Fig. S5). Interestingly, however, the 2B4+CD160+PD-1− CD8 T-cell population expressed the highest levels of CD160 (MFI) and 2B4 (MFI) as compared to any other CD8 T-cell population (Fig. S5). Taken together, these data demonstrate that a) CD160 and PD-1 signaling negatively regulate TCR-mediated CD8 T-cell signaling, b) the functional restoration induced by the blockade of multiple co-inhibitory molecules may be incomplete, and c) the cells expressing several co-inhibitory molecules are more profoundly impaired than cells expressing only one co-inhibitory molecule.
Fig. 8. CD160 blockade significantly increases virus-specific CD8 T-cell proliferation. 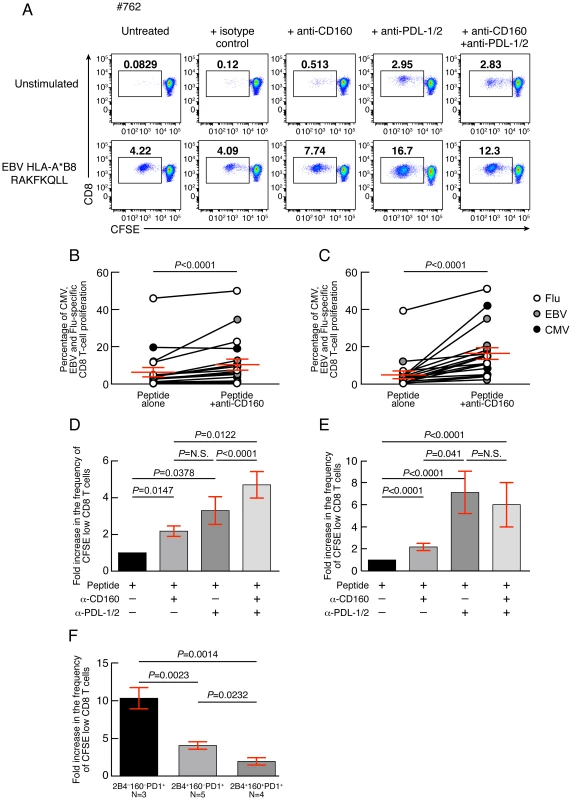
(A) Representative example of EBV-specific CD8 T-cell proliferation (#675 EBV HLA-B*08 RAKFKQLL) in presence or in absence of anti-CD160 mAbs and/or anti-PDL-1/2 mAbs assessed by CFSE-based assay. (B) Percentage of CMV, EBV and Flu-specific CD8 T-cell proliferation in presence or not of anti-CD160 mAb (N = 21). (C) Percentage of CMV, EBV and Flu-specific CD8 T-cell proliferation in presence or not of anti-PDL-1/2 mAb (N = 21). (D) Fold increase in the frequency of CFSE low CD8 T cells in presence of anti-CD160 and/or anti-PDL-1/2 mAb as compared to untreated virus-specific CD8 T cells from virus-specific CD8 T-cell populations harboring both 2B4+CD160−PD-1+ and 2B4+CD160+PD-1− CD8 T-cell populations (2B4+CD160−PD-1+ and 2B4+CD160+PD-1− virus-specific CD8 T cells >10%) (N = 5) or (E) from virus-specific CD8 T-cell populations containing the highest proportion of 2B4+CD160+PD-1+ CD8 T-cell population (2B4+CD160+PD-1+ virus-specific CD8 T cells >30%) (N = 6). (F) Fold increase in the frequency of CFSE low CD8 T cells in presence of anti-PDL-1/2 mAb on virus-specific CD8 T cells dominated by 2B4−CD160−PD-1+, 2B4+CD160−PD-1+ or 2B4+CD160+PD-1+ CD8 T-cell populations. Red bars correspond to mean ± SEM. Statistical significance (P values) were obtained using One-way ANOVA (Kruskal-Wallis test) (panel D–F) followed by a paired Student's t-test (panels B–C), Wilcoxon Signed Rank test (D–E), or unpaired Student's t-test (panels F). Restoration of CD8 T-cell proliferation by CD160/CD160-ligand blockade directly correlates with the level of the ex vivo CD160 expression
Since the expression level of co-inhibitory molecules on virus-specific CD8 T cells is highly heterogeneous (Fig. 1), the influence of CD160 and PD-1 signaling blockade was evaluated with regard to the ex vivo expression levels of CD160 and PD-1. The representative flow cytometric profiles as well as the cumulative data showed that CD160 signaling blockade was significantly more potent in cells harboring high level of CD160 (percentage of virus-specific CD8 expressing more than 20% of CD160) versus cells harboring low level of CD160 (percentage of virus-specific CD8 expressing less than 20% of CD160) (P<0.0001) (Fig. 9A–E). In addition, the degree of restoration of virus-specific CD8 T-cell proliferation capacity induced by CD160 blockade directly correlated with the ex vivo proportion of 2B4+CD160+PD-1+ or 2B4+CD160+PD-1− virus-specific CD8 T cells (r = 0.6818; P = 0.0003 and r = 0.7141; P<0.0001, respectively) (Fig. 9F–G). Interestingly, the effect of the blockade of PD-1/PD-L1/2 pathway on the degree of the restoration of virus-specific CD8 T-cell proliferation capacity was not associated with the ex vivo proportion of 2B4+CD160+PD-1+, 2B4+CD160−PD-1+ or 2B4−CD160−PD-1+ virus-specific CD8 T cells (r = −0.1611; P>0.05, and r = −0.2566; P>0.05 and r = 0.2949; P>0.05, respectively) (Fig. 9H–J).
Fig. 9. Restoration of CD8 T-cell proliferation by CD160/CD160-ligand blockade directly correlates with the level of the ex vivo CD160 expression. 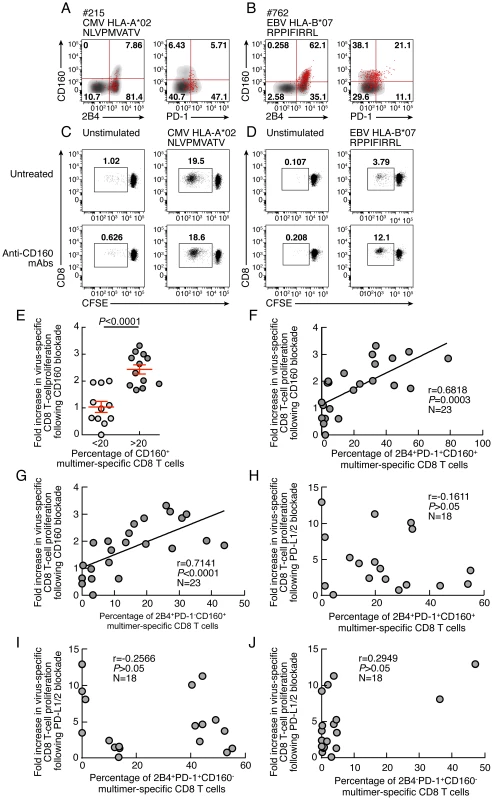
(A–B) Representative flow cytometric profile of 2B4, CD160 and PD-1 expression of CMV (#215 CMV HLA-A*02 NLVPMVATV) and EBV (#762 EBV HLA-B*07 RPPIFIRRL)-specific CD8 T cells detected by multimer staining (red) compared with total CD8 T cells (black/grey). (C–D) Representative examples of CMV (#215 CMV HLA-A*02 NLVPMVATV) and EBV (#762 EBV HLA-B*07 RPPIFIRRL)-specific CD8 T-cell proliferation in presence or not of anti-CD160 mAbs assessed by CFSE-based assay. (E) Impact of CD160 expression on the restoration of CD8 T-cell proliferation by CD160/CD160-ligand blockade. (F–G) Correlation between fold increase in proliferation capacity (y axes) upon CD160 blockage and percentage of 2B4+CD160+PD-1+ or 2B4+CD160+PD-1− virus-specific CD8 T cells. (H–J) Correlation between fold increase in proliferation capacity (y axes) upon PDL-1/2 blockage and percentage of 2B4+CD160+PD-1+, 2B4+CD160−PD-1+ or 2B4−CD160−PD-1+ virus-specific CD8 T cells (x axes). Statistical significance (P values) in B–I were obtained using Spearman's rank correlations. CD160 expression is not up-regulated upon T-cell activation or proliferation
Previous studies have indicated that PD-1 expression increased following T-cell stimulation and activation [27]. However, the regulation of CD160 expression following T-cell activation or proliferation remains unclear. We then evaluated the expression levels of PD-1 and CD160 co-inhibitory molecules following TCR stimulation using flow cytometry. Briefly, cells were stained with CFSE, stimulated with anti-CD3 plus anti-CD28 Abs and the expression levels of PD-1 and CD160 were assessed by flow cytometry at day 0, 1, 2, 3 and 5. Representative flow cytometric profiles as well as cumulative data showed that CD160 expression was down-regulated in CD8 T cells upon T-cell activation and proliferation, while PD-1 expression increased (Fig. 10A–B).
Fig. 10. Kinetic of CD160 or PD-1 expression on CD8 T cells stimulated upon T-cell stimulation. 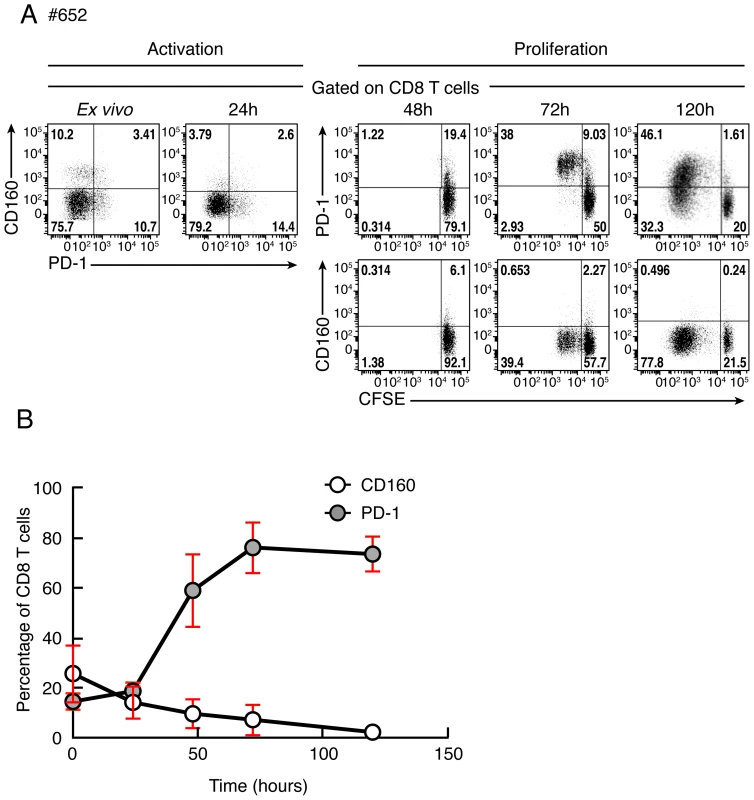
(A) Representative flow cytometric profile of CD160 and PD-1 expression on CD8 T cells after 0, 24, 48, 72 and 120 hours of stimulation with anti-CD3/anti-CD28 magnetic beads. CD8 T-cell proliferation was also measured by CFSE-based assay at 48, 72 and 120 hours after stimulation. (B) Cumulative data of CD160 or PD-1-expressing CD8 T-cell frequencies at distinct time points after stimulation. Red bars correspond to mean ± SEM. Discussion
Several studies have demonstrated that the increased expression of co-inhibitory molecules including PD-1, 2B4 and CD160 during chronic viral infections is associated with CD8 T-cell dysfunction [2], [17], [18], [28]. However, the relative contribution of individual co-inhibitory molecules in the T-cell functional impairment remains unclear.
In the present study, we have evaluated the impact of individual co-inhibitory molecules expression such as 2B4, PD-1 and CD160 on virus-specific CD8 T-cell functions. To address this issue, we have performed both phenotypic and functional characterization of Flu, EBV and CMV-specific CD8 T cells in healthy individuals. We show that EBV and CMV-specific CD8 T cells contained higher frequency of cells co-expressing 2B4, CD160 and PD-1 in different combinations while Flu-specific CD8 T cells had higher frequencies of triple negative, single PD-1 or dual PD-1/2B4 CD8 T-cell populations. In particular, the percentage of CD160 expression was significantly lower in Flu-specific CD8 T cells than in CMV or EBV-specific CD8 T cells. Interestingly, the level of total PD-1 was not significantly different in Flu, EBV or CMV-specific CD8 T cells. These data suggest that CD160 expression in virus-specific CD8 T cells is associated with chronic virus infections such as EBV and CMV. Of note, co-inhibitory molecule expression on virus-specific CD8 T cells are likely influenced by the pathogen characteristics, the type of viral infection (cleared versus chronic viral infections), the cytokine milieu, the nature of the infected cell population.
Proliferation capacity is one of the first CD8 T-cell functions lost during the progression to CD8 T-cell exhaustion [11]–[14], [20]. In this regard, we assessed which pattern of co-inhibitory molecules expression had the greater impact on the proliferation capacity of virus-specific CD8 T cells. We showed that the proportion of total CD160 expression and in particular of 2B4+CD160+PD-1+ or 2B4+CD160+PD-1− CD8 T-cell populations inversely correlated with the proliferation capacity thus suggesting that CD160 expression was associated with reduced CD8 T-cell proliferation capacity independently of PD-1 expression. The reduced proliferation capacity of sorted virus-specific 2B4+CD160+PD-1+, 2B4+CD160+PD-1−, 2B4+CD160−PD-1+, 2B4+CD160−PD-1− CD8 T-cell populations as compared to 2B4−CD160−PD-1+ and 2B4−CD160−PD-1− CD8 T-cell populations suggest that the proliferation capacity CD8 T cells is influenced by co-inhibitory molecule expression.
The intrinsic proliferation capacity of the different CD8 T-cell populations was then evaluated and showed that CD8 T cells expressing CD160 and/or PD-1 were endowed with reduced proliferation capacity as compared to CD160 and PD-1 negative CD8 T-cell populations. Interestingly, the proliferation capacity of 2B4+CD160+PD-1+ and 2B4+CD160+PD-1− CD8 T cells was not significantly different, suggesting that CD160 expressing CD8 T cells are endowed with reduced proliferation capacity, independently of PD-1 expression.
We then showed that 2B4+CD160+PD-1+ or 2B4+CD160+PD-1− CD8 T-cell populations also had a reduced capacity to produce IL-2, IFN-γ and perforin as compared to CD160− CD8 T-cell populations demonstrating that CD160+ CD8 T-cell populations were more functionally impaired than CD160− CD8 T-cell populations independently of PD-1 expression. Since reduced IL-2 production capacity is commonly associated with increased differentiation state [21], the differentiation state was evaluated together with the expression of co-inhibitory molecules. We showed that co-inhibitory molecule expression is associated with differentiation state [22]. However in depth analyses indicated that significant differences are present within each CD8 T-cell populations, particularly among PD-1 and/or CD160-expressing populations and suggested that CD8 T-cell functions might be modulated by co-inhibitory molecule expression.
The functions of CD160 are complex, and still remain under debate, with potentially various roles i.e. either stimulatory or inhibitory, depending on the cell type, the expression of the ligands (HVEM or MHC class I) [29]–[32] and the fact that CD160 exist in two isoforms (spliced variants) with and without transmembrane (TM) domain [33], [34]. In order to determine whether CD160/CD160-ligand interactions could negatively regulate CD8 T-cell signaling, virus-specific CD8 T-cell proliferation was assessed in the presence or in the absence of mAbs that block CD160/CD160-ligand signaling. Since two molecules have been shown to interact with CD160 i.e. HVEM (member of the TNF receptor superfamily) and MHC class I molecules [29]–[32], blocking anti-CD160 Abs that prevent both possible interactions were used [31], [35]. Of note, HVEM is broadly distributed and expressed in hematopoietic and non-hematopoietic cells [36]. The ability of anti-CD160 Abs to increase virus-specific CD8 T-cell proliferation demonstrated that CD160 signaling negatively regulates TCR-mediated CD8 T-cell signaling. Interestingly, the level of restoration of virus-specific CD8 T-cell proliferation capacity induced by CD160 blockade was significantly more potent in cells harboring high level of CD160 and directly correlated with the ex vivo proportion of CD160 expression independently of PD-1 expression. These results suggested that 2B4+CD160+PD-1+ and 2B4+CD160+PD-1− CD8 T-cell populations were both rescued by CD160/CD160-ligands signaling blockade.
We then showed that 2B4+CD160+PD-1+, 2B4+CD160+PD-1− and 2B4+CD160−PD-1+ CD8 T-cell populations had reduced expression of perforin as compared to 2B4+CD160−PD-1− CD8 T-cell population, suggesting that the expression of CD160 and/or PD-1 on 2B4+ CD8 T cells is associated with a reduced capacity to express perforin. Interestingly, CD160 signaling is commonly associated with enhanced NK-cell cytotoxic activity [30]–[32] suggesting that CD160 might have distinct functions depending upon the cell subset considered. Indeed, CD160 is a GPI-anchored protein lacking both transmembrane (TM) and intracytoplasmic domains [33], [34]). Therefore, the signaling cascade(s) triggered following CD160/CD160-ligand interactions might depend on the cell-type, the ligand (either HVEM or MHC class I molecules), the density of CD160 expression, the potential co expression with CD160-TM and on the downstream adaptor proteins and/or signaling molecules, which are still not fully characterized [37], [38]. We hypothesize that in CD8 T cells, CD160 might be associated with a specific phosphatase that might reduce the signal triggered following TCR/co-stimulatory receptors engagement. In addition, CD160 exists in two isoforms (spliced variants) with and without TM domain [33], [34]. While NK cells can express both isoforms i.e. CD160 and CD160 TM, that are modulated following IL-15 stimulation [34], CD8 T cells do not express CD160 TM directly ex vivo nor following IL-15 or TCR stimulation ([34] and Fig. S6). This feature may explain the dichotomic role of CD160 i.e. involved in CD8 T-cell negative regulation and NK-cell cytotoxic activity [17], [18], [30]–[32].
As previously demonstrated PD-1 signaling blockade by anti-PD-L1/2 Abs significantly increased virus-specific CD8 T-cell proliferation [12], [13], [17]. However, the PD-1 signaling blockade was significantly more potent on virus-specific CD8 T cells containing predominant 2B4−CD160−PD-1+ CD8 T-cell population as compared to virus-specific CD8 T cells with predominant 2B4+CD160−PD-1+ or 2B4+CD160+PD-1+ CD8 T-cell populations. These data suggest that cells expressing several co-inhibitory molecules are more profoundly impaired than cells expressing only one co-inhibitory molecule. Along the same line, PD-1 signaling blockade was on average more potent than CD160 signaling blockade in restoring virus-specific CD8 T-cell proliferation. Interestingly, the combined anti-CD160/anti-PD-L1/2 treatment showed additive effects only on virus-specific CD8 T cells containing both 2B4+CD160−PD-1+ or 2B4+CD160+PD-1− CD8 T-cell populations, but not on virus-specific CD8 T cells co-expressing PD-1 and CD160. We postulate that cells expressing both co-inhibitory receptors might be intrinsically impaired, and their functions might be only partially reversible. Of note, PD-1 mean fluorescent intensity (MFI) was not significantly different between 2B4−CD160−PD-1+ and 2B4+CD160+PD-1+ CD8 T-cell populations (Fig. S5), suggesting that the difference in the restoration of proliferation capacity was not due to PD-1 expression level but likely on a different intrinsic capacity of the cells to proliferate.
Taken together, these data suggest that the functional restoration induced by the blockade of several co-inhibitory molecules may be incomplete and that cells expressing several co-inhibitory molecules are more profoundly impaired than cells expressing only one co-inhibitory molecule.
Consistently with a previous study [39], we showed that PD-1 expression was up-regulated following T-cell activation and proliferation. However, CD160 expression was down-regulated following T-cell activation and proliferation. Thus, PD-1/PD-1-Ligand blockade may have an effect on both cells expressing PD-1 at the time of stimulation and on proliferating cells while CD160 blockade may only act on cells expressing CD160 at the time of stimulation. The differences in CD160 and PD-1 expression may contribute to understand 1) the higher potency observed of the PD-1/PD-1-Ligand blockade as compared to CD160 blockade in restoring virus-specific CD8 T-cell proliferation and 2) the absence of correlation between the level of restoration of virus-specific CD8 T-cell proliferation capacity induced by PD-1/PD-L1 blockade and the ex vivo proportion of PD-1-expressing CD8 T cells.
Interestingly, the 2B4−CD160−PD-1+ CD8 T-cell population was significantly enriched in Flu-specific CD8 T cells as compared to EBV or CMV-specific CD8 T cells, and had higher IL-2 production capacity than all the other populations investigated. Furthermore, the 2B4−CD160−PD-1+ CD8 T-cell population expressed similar level of PD-1 (MFI) compared to the 2B4+CD160+PD-1+ CD8 T-cell population. The percentage of 2B4−CD160−PD-1+ CD8 T-cell population expressing EOMES, Tbet and CD57 was significantly lower than 2B4+CD160−PD-1+ and 2B4+CD160+PD-1+ CD8 T-cell populations. These data suggest that 2B4−CD160−PD-1+ CD8 T cells may be less functionally impaired than 2B4+CD160−PD-1+ and 2B4+CD160+PD-1+ CD8 T-cell populations.
In conclusion, while accumulation of different immune check point blockers is clearly associated with progressive dysfunction, the present study demonstrates that CD160-mediated regulation of CD8 T-cell functions is independent of PD-1 expression thus providing evidence that CD160 contributes to the regulation of CD8 T-cell functions.
Materials and Methods
Study group, ethics statement and cell isolation
Forty subjects were recruited in this study. Blood samples were obtained at the local blood bank (Centre de transfusion sanguine (CTS), Lausanne, Switzerland). The use of samples used in this study was approved by the Institutional Review Board of the CTS, and all subjects gave written informed consent. Only individuals with no sign of HIV, HAV, HBV and HCV infections were included. Blood mononuclear cells were isolated as previously described [40].
Antibodies
The following monoclonal antibodies (mAbs) were used in different combinations. CD8-PB, CD3-APC-H7, PD-1-PECy7, PD-1-PB, IFN-γ-AF700, IL-2-PE, CD4-PB, granzyme B-AF700, perforin-APC were purchased from Becton Dickinson (BD, San Diego, CA), CD45RA-ECD, CD4-ECD from Beckman Coulter (Fullerton, CA, USA), CCR7-FITC from R&D Systems (Minneapolis, MN, USA), 2B4-PECY5.5, CD160-APC, CD160-PE from BioLegend (San Diego, CA, USA), CD4-eFluor650NC, CD8-eFluor625NC from eBioscience.
Ex vivo analyses of CD8 T cells
Cryo-preserved blood mononuclear cells (1–2×10⁶) cells were washed, stained (30 min; 4°C) for dead cells using the Aqua LIVE/DEAD stain kit (Invitrogen) and, when required, stained with appropriately tittered peptide-MHC class I multimer complexes at 4°C for 30′ in Ca2+-free media as described [24]. Cells were then washed and stained (30 min; 4°C) with the following mAbs: CD3, CD8, CD4, PD-1, CD160 and 2B4.
Virus-specific CD8 T-cell proliferation
Overnight-rested cryopreserved blood mononuclear cells (106 in 1 ml of complete medium) were stained with 0.25 µM 5,6-carboxyfluorescein succinimidyl ester (CFSE, Molecular Probes, USA) as previously described [41], and stimulated with CMV, EBV or Flu peptides (1 µg/ml), 200 ng/ml of SEB (positive control; Sigma-Aldrich) or left unstimulated (negative control) in presence or in absence of anti-CD160 (2 µg/ml; MBL) and/or anti-PD-L1/2 (10 µg/mL) [13]. At day 6, cells were harvested and stained (4°C; 20 min) using the violet or aqua LIVE/DEAD stain kit (Invitrogen) and Abs (4°C; 30 min) to CD3, CD4, CD8. Frequencies of proliferating CFSElow CD8 T cells were assessed by flow cytometry.
Evaluation of the kinetic of CD160 and PD-1 expression on CD8 T cells after activation and expansion
Cryopreserved blood mononuclear cells (106 in 1 ml of complete medium) were stained with 0.25 µM 5,6-carboxyfluorescein succinimidyl ester (CFSE, Molecular Probes, USA) as previously described [41], and stimulated with anti-CD3/anti-CD28 magnetic beads (Dynabeads, Invitrogen). The expression of CD160 and PD-1 on CD8 T cells was evaluated after 0, 24, 48, 72 and 120 hours of stimulation by anti-CD3/anti-CD28 magnetic beads. CD8 T-cell proliferation was also evaluated by CFSE dilution.
Intracellular cytokine staining (ICS)
PBMC were stimulated overnight in complete media (RPMI (Invitrogen), 10% fetal calf serum (FCS; Invitrogen), 100 µg/ml penicillin, 100 unit/ml streptomycin (BioConcept)) with Staphyloccocus enterotoxin B (SEB; 250 ng/mL) or left unstimulated (negative control) in the presence of Golgiplug (1 µl/ml; BD) and anti-PD1, anti-CD160 and anti-2B4 mAbs. At the end of the stimulation period, cells were washed, stained (20 min; 4°C) for dead cells using the Aqua LIVE/DEAD stain kit (Invitrogen), permeabilized (20 min; 20°C) (Cytofix/Cytoperm, BD) and stained (30 min; 20°C) with mAbs to CD3, CD8, CD45RA, CCR7, IFN-γ and IL-2 [42].
Perforin and granzyme B expression assessment
PBMC were washed, stained (20 min; 4°C) for dead cells using the Aqua LIVE/DEAD stain kit (Invitrogen). Cells were then washed and stained (30 min; 4°C) with the following mAbs: CD3, CD8, PD-1, 2B4, CD160, CCR7 and CD45RA. Cells were then permeabilized (20 min; 20°C) (Cytofix/Cytoperm, BD) and stained (30 min; 20°C) with mAbs to perforin and granzyme B [23].
CD45RA, CCR7, EOMES, T-bet and CD57 expression assessment
PBMC were washed, stained (20 min; 4°C) for dead cells using the Aqua LIVE/DEAD stain kit (Invitrogen). Cells were then washed and stained (30 min; 4°C) with the following mAbs in different combinations: CD3, CD8, PD-1, 2B4, CD160 and CD57 or CD3, CD8, PD-1, 2B4, CD160, CCR7 and CD45RA. Cells were then permeabilized (1 h; 4°C) (Foxp3 Fixation/Permeabilization Kit; eBioscience) and stained (30 min; 4°C) with mAbs to EOMES and T-bet.
Proliferation of CD8 T-cell populations
Cryopreserved CD8 T cells (30–40×106 cells) previously selected by MACS cell separation (Miltenyi kit) were washed, stained (20 min; 4°C) for dead cells using the Aqua LIVE/DEAD stain kit (Invitrogen). Cells were then washed and stained (30 min; 4°C) with the following mAbs: CD8, PD-1, 2B4, CD160, CD45RA, CCR7. CD8 T-cell populations were sorted by BD FACSAria III on the basis of 2B4, PD-1 and CD160 expression after exclusion of naïve T cells (CD45RA+CCR7+). Sorted populations were labeled with CFSE and stimulated with viral peptides (1 µg/mL) in the context of irradiated (40 Gy) autologous CD8-depleted PBMCs (ratio CD8/feeder cells 1∶10) or in anti-CD3 (10 ug/ml) and anti-CD28 (0.5 ug/ml) mAbs coated plate or left unstimulated. Proliferation was assessed at day 6 by flow cytometry. Cells were washed, stained (20 min; 4°C) for dead cells using the Aqua LIVE/DEAD stain kit (Invitrogen). Cells were then washed and stained (30 min; 4°C) with anti-CD8 and anti-CD3 mAbs.
Assessment of CD160 and CD160-TM expression
CD160 and CD160-TM expression were assessed both ex vivo and after in vitro expansion. To assess their expression ex vivo PBMC were washed, stained (20 min; 4°C) for dead cells using the Aqua LIVE/DEAD stain kit (Invitrogen). Cells were then washed and stained (30 min; 4°C) with the following mAbs: CD8, CD3, CD56, CD160, CD160-TM (rabbit unconjugated). Cells were then washed and stained (30 min; 4°C) with anti-rabbit secondary Ab. To assess their expression after in vitro expansion PBMC were labeled with CFSE and stimulated with IL-15 (50 ng/mL) or with anti-CD3 (10 ug/ml) and anti-CD28 (0.5 ug/ml) mAbs coated plate. CD160 and CD160-TM expression were assessed at day 6 by flow cytometry. Cells were washed, stained (20 min; 4°C) for dead cells using the Aqua LIVE/DEAD stain kit (Invitrogen). Cells were then washed and stained (30 min; 4°C) with the following mAbs: CD8, CD3, CD56, CD160, CD160-TM (rabbit unconjugated). Cells were then washed and stained (30 min; 4°C) with anti-rabbit secondary Ab.
Flow cytometry analyses
Cells were fixed with CellFix (BD), acquired on an LSRII SORP (4 lasers: 405, 488, 532 and 633 nm) and analyzed using FlowJo (version 8.8.2) (Tree star Inc, Ashland, OR, USA) and SPICE 4.2.3. When required, analysis and presentation of distributions was performed using SPICE version 5.1, downloaded from <http://exon.niaid.nih.gov/spice> [43]. The number of lymphocyte-gated events ranged between 5×10⁵ and 106 in the flow cytometry experiments.
Statistical analyses
Statistical significance (P values) was obtained using one-way ANOVA (Kruskal-Wallis test) followed by Student's t test for multiple comparisons or a Spearman rank test for correlations using GraphPad Prism version 5.0 (San Diego, CA). Statistical analyses of global cytokine profiles (pie charts) were performed by partial permutation tests using the SPICE software as described [43].
Supporting Information
Zdroje
1. LenschowDJ, BluestoneJA (1993) T cell co-stimulation and in vivo tolerance. Curr Opin Immunol 5 : 747–752.
2. ViganoS, PerreauM, PantaleoG, HarariA (2012) Positive and negative regulation of cellular immune responses in physiologic conditions and diseases. Clin Dev Immunol 2012 : 485781.
3. LeibsonPJ (2004) The regulation of lymphocyte activation by inhibitory receptors. Curr Opin Immunol 16 : 328–336.
4. ChenL (2004) Co-inhibitory molecules of the B7-CD28 family in the control of T-cell immunity. Nature reviews Immunology 4 : 336–347.
5. CaiG, FreemanGJ (2009) The CD160, BTLA, LIGHT/HVEM pathway: a bidirectional switch regulating T-cell activation. Immunol Rev 229 : 244–258.
6. CannonsJL, TangyeSG, SchwartzbergPL (2011) SLAM family receptors and SAP adaptors in immunity. Annu Rev Immunol 29 : 665–705.
7. CarrenoBM, CollinsM (2002) The B7 family of ligands and its receptors: new pathways for costimulation and inhibition of immune responses. Annu Rev Immunol 20 : 29–53.
8. KhaitanA, UnutmazD (2011) Revisiting immune exhaustion during HIV infection. Curr HIV/AIDS Rep 8 : 4–11.
9. LenschowDJ, WalunasTL, BluestoneJA (1996) CD28/B7 system of T cell costimulation. Annu Rev Immunol 14 : 233–258.
10. WattsTH (2005) TNF/TNFR family members in costimulation of T cell responses. Annu Rev Immunol 23 : 23–68.
11. DayCL, KaufmannDE, KiepielaP, BrownJA, MoodleyES, et al. (2006) PD-1 expression on HIV-specific T cells is associated with T-cell exhaustion and disease progression. Nature 443 : 350–354.
12. PetrovasC, CasazzaJP, BrenchleyJM, PriceDA, GostickE, et al. (2006) PD-1 is a regulator of virus-specific CD8+ T cell survival in HIV infection. J Exp Med 203 : 2281–2292.
13. TrautmannL, JanbazianL, ChomontN, SaidEA, GimmigS, et al. (2006) Upregulation of PD-1 expression on HIV-specific CD8+ T cells leads to reversible immune dysfunction. Nat Med 12 : 1198–1202.
14. McMahanRH, Golden-MasonL, NishimuraMI, McMahonBJ, KemperM, et al. (2010) Tim-3 expression on PD-1+ HCV-specific human CTLs is associated with viral persistence, and its blockade restores hepatocyte-directed in vitro cytotoxicity. J Clin Invest 120 : 4546–4557.
15. WherryEJ, AhmedR (2004) Memory CD8 T-cell differentiation during viral infection. J Virol 78 : 5535–5545.
16. WherryEJ, BlattmanJN, Murali-KrishnaK, van der MostR, AhmedR (2003) Viral persistence alters CD8 T-cell immunodominance and tissue distribution and results in distinct stages of functional impairment. J Virol 77 : 4911–4927.
17. YamamotoT, PriceDA, CasazzaJP, FerrariG, NasonM, et al. (2011) Surface expression patterns of negative regulatory molecules identify determinants of virus-specific CD8+ T-cell exhaustion in HIV infection. Blood 117 : 4805–4815.
18. PeretzY, HeZ, ShiY, Yassine-DiabB, GouletJP, et al. (2012) CD160 and PD-1 co-expression on HIV-specific CD8 T cells defines a subset with advanced dysfunction. PLoS Pathog 8: e1002840.
19. ViganoS, Bellutti EndersF, MiconnetI, CelleraiC, SavoyeAL, et al. (2013) Rapid Perturbation in Viremia Levels Drives Increases in Functional Avidity of HIV-specific CD8 T Cells. PLoS Pathog 9: e1003423.
20. BarberDL, WherryEJ, MasopustD, ZhuB, AllisonJP, et al. (2006) Restoring function in exhausted CD8 T cells during chronic viral infection. Nature 439 : 682–687.
21. MakedonasG, HutnickN, HaneyD, AmickAC, GardnerJ, et al. (2010) Perforin and IL-2 upregulation define qualitative differences among highly functional virus-specific human CD8 T cells. PLoS Pathog 6: e1000798.
22. LegatA, SpeiserDE, PircherH, ZehnD, Fuertes MarracoSA (2013) Inhibitory Receptor Expression Depends More Dominantly on Differentiation and Activation than “Exhaustion” of Human CD8 T Cells. Front Immunol 4 : 455.
23. HarariA, EndersFB, CelleraiC, BartPA, PantaleoG (2009) Distinct profiles of cytotoxic granules in memory CD8 T cells correlate with function, differentiation stage, and antigen exposure. J Virol 83 : 2862–2871.
24. CelleraiC, PerreauM, RozotV, EndersFB, PantaleoG, et al. (2010) Proliferation capacity and cytotoxic activity are mediated by functionally and phenotypically distinct virus-specific CD8 T cells defined by interleukin-7R{alpha} (CD127) and perforin expression. Journal of virology 84 : 3868–3878.
25. SpeiserDE, ColonnaM, AyyoubM, CellaM, PittetMJ, et al. (2001) The activatory receptor 2B4 is expressed in vivo by human CD8+ effector alpha beta T cells. J Immunol 167 : 6165–6170.
26. PetrovasC, ChaonB, AmbrozakDR, PriceDA, MelenhorstJJ, et al. (2009) Differential association of programmed death-1 and CD57 with ex vivo survival of CD8+ T cells in HIV infection. J Immunol 183 : 1120–1132.
27. NishimuraH, AgataY, KawasakiA, SatoM, ImamuraS, et al. (1996) Developmentally regulated expression of the PD-1 protein on the surface of double-negative (CD4-CD8-) thymocytes. Int Immunol 8 : 773–780.
28. BengschB, SeigelB, RuhlM, TimmJ, KuntzM, et al. (2010) Coexpression of PD-1, 2B4, CD160 and KLRG1 on exhausted HCV-specific CD8+ T cells is linked to antigen recognition and T cell differentiation. PLoS Pathog 6: e1000947.
29. CaiG, AnumanthanA, BrownJA, GreenfieldEA, ZhuB, et al. (2008) CD160 inhibits activation of human CD4+ T cells through interaction with herpesvirus entry mediator. Nat Immunol 9 : 176–185.
30. AgrawalS, MarquetJ, FreemanGJ, TawabA, BouteillerPL, et al. (1999) Cutting edge: MHC class I triggering by a novel cell surface ligand costimulates proliferation of activated human T cells. J Immunol 162 : 1223–1226.
31. BarakonyiA, RabotM, Marie-CardineA, Aguerre-GirrM, PolgarB, et al. (2004) Cutting edge: engagement of CD160 by its HLA-C physiological ligand triggers a unique cytokine profile secretion in the cytotoxic peripheral blood NK cell subset. J Immunol 173 : 5349–5354.
32. Le BouteillerP, TabiascoJ, PolgarB, KozmaN, GiustinianiJ, et al. (2011) CD160: a unique activating NK cell receptor. Immunol Lett 138 : 93–96.
33. AnumanthanA, BensussanA, BoumsellL, ChristAD, BlumbergRS, et al. (1998) Cloning of BY55, a novel Ig superfamily member expressed on NK cells, CTL, and intestinal intraepithelial lymphocytes. J Immunol 161 : 2780–2790.
34. GiustinianiJ, BensussanA, Marie-CardineA (2009) Identification and characterization of a transmembrane isoform of CD160 (CD160-TM), a unique activating receptor selectively expressed upon human NK cell activation. J Immunol 182 : 63–71.
35. ChabotS, Jabrane-FerratN, BigotK, TabiascoJ, ProvostA, et al. (2011) A novel antiangiogenic and vascular normalization therapy targeted against human CD160 receptor. J Exp Med 208 : 973–986.
36. del RioML, LucasCL, BuhlerL, RayatG, Rodriguez-BarbosaJI (2010) HVEM/LIGHT/BTLA/CD160 cosignaling pathways as targets for immune regulation. Journal of leukocyte biology 87 : 223–235.
37. RabotM, El CostaH, PolgarB, Marie-CardineA, Aguerre-GirrM, et al. (2007) CD160-activating NK cell effector functions depend on the phosphatidylinositol 3-kinase recruitment. Int Immunol 19 : 401–409.
38. LiuFT, GiustinianiJ, FarrenT, JiaL, BensussanA, et al. (2010) CD160 signaling mediates PI3K-dependent survival and growth signals in chronic lymphocytic leukemia. Blood 115 : 3079–3088.
39. HarariA, CelleraiC, EndersFB, KostlerJ, CodarriL, et al. (2007) Skewed association of polyfunctional antigen-specific CD8 T cell populations with HLA-B genotype. Proc Natl Acad Sci U S A 104 : 16233–16238.
40. PerreauM, MennechetF, SerratriceN, GlasgowJN, CurielDT, et al. (2007) Contrasting effects of human, canine, and hybrid adenovirus vectors on the phenotypical and functional maturation of human dendritic cells: implications for clinical efficacy. J Virol 81 : 3272–3284.
41. PerreauM, WellesHC, HarariA, HallO, MartinR, et al. (2011) DNA/NYVAC Vaccine Regimen Induces HIV-Specific CD4 and CD8 T-Cell responses in Intestinal Mucosa. Journal of virology 85 (19) 9854–62..
42. PerreauM, WellesHC, HarariA, CalandraT, RogerT, et al. (2011) Modulation of human memory T-cell function by different antigen-presenting cells. Eur J Immunol 42 (3) 799–802.
43. RoedererM, NozziJL, NasonMC (2011) SPICE: exploration and analysis of post-cytometric complex multivariate datasets. Cytometry Part A: the journal of the International Society for Analytical Cytology 79 : 167–174.
Štítky
Hygiena a epidemiológia Infekčné lekárstvo Laboratórium
Článek Out-of-Sequence Signal 3 as a Mechanism for Virus-Induced Immune Suppression of CD8 T Cell ResponsesČlánek RNF26 Temporally Regulates Virus-Triggered Type I Interferon Induction by Two Distinct MechanismsČlánek Mouse, but Not Human, ApoB-100 Lipoprotein Cholesterol Is a Potent Innate Inhibitor of Pneumolysin
Článok vyšiel v časopisePLOS Pathogens
Najčítanejšie tento týždeň
2014 Číslo 9- Parazitičtí červi v terapii Crohnovy choroby a dalších zánětlivých autoimunitních onemocnění
- Očkování proti virové hemoragické horečce Ebola experimentální vakcínou rVSVDG-ZEBOV-GP
- Koronavirus hýbe světem: Víte jak se chránit a jak postupovat v případě podezření?
-
Všetky články tohto čísla
- Virus Control Goes Epigenetic
- The Role of Iron in Prion Disease and Other Neurodegenerative Diseases
- The Ins and Outs of Rust Haustoria
- Prion Strains and Amyloid Polymorphism Influence Phenotypic Variation
- Teaching Fido New ModiFICation Tricks
- Can Enhance Infection in Mosquitoes: Implications for Malaria Control?
- MIF Contributes to Associated Immunopathogenicity Development
- Persistence of Virus Reservoirs in ART-Treated SHIV-Infected Rhesus Macaques after Autologous Hematopoietic Stem Cell Transplant
- Bacillus Calmette-Guerin Infection in NADPH Oxidase Deficiency: Defective Mycobacterial Sequestration and Granuloma Formation
- EhCoactosin Stabilizes Actin Filaments in the Protist Parasite
- Molecular Insights Into the Evolutionary Pathway of O1 Atypical El Tor Variants
- LprG-Mediated Surface Expression of Lipoarabinomannan Is Essential for Virulence of
- Structural Correlates of Rotavirus Cell Entry
- Multivalent Adhesion Molecule 7 Clusters Act as Signaling Platform for Host Cellular GTPase Activation and Facilitate Epithelial Barrier Dysfunction
- The Effects of Vaccination and Immunity on Bacterial Infection Dynamics
- Myeloid Derived Hypoxia Inducible Factor 1-alpha Is Required for Protection against Pulmonary Infection
- Functional Characterisation of Germinant Receptors in and Presents Novel Insights into Spore Germination Systems
- Global Analysis of Neutrophil Responses to Reveals a Self-Propagating Inflammatory Program
- Host Cell Invasion by Apicomplexan Parasites: The Junction Conundrum
- Comparative Phenotypic Analysis of the Major Fungal Pathogens and
- Unravelling the Multiple Functions of the Architecturally Intricate β-galactosidase, BgaA
- Sialylation of Prion Protein Controls the Rate of Prion Amplification, the Cross-Species Barrier, the Ratio of PrP Glycoform and Prion Infectivity
- Symbionts Commonly Provide Broad Spectrum Resistance to Viruses in Insects: A Comparative Analysis of Strains
- Ontogeny of Recognition Specificity and Functionality for the Broadly Neutralizing Anti-HIV Antibody 4E10
- Identification and Characterisation of a Hyper-Variable Apoplastic Effector Gene Family of the Potato Cyst Nematodes
- Crimean-Congo Hemorrhagic Fever Virus Entry into Host Cells Occurs through the Multivesicular Body and Requires ESCRT Regulators
- Age-Dependent Enterocyte Invasion and Microcolony Formation by
- CD160-Associated CD8 T-Cell Functional Impairment Is Independent of PD-1 Expression
- Functional Fluorescent Protein Insertions in Herpes Simplex Virus gB Report on gB Conformation before and after Execution of Membrane Fusion
- The Tudor Domain Protein Spindlin1 Is Involved in Intrinsic Antiviral Defense against Incoming Hepatitis B Virus and Herpes Simplex Virus Type 1
- Transgenic Analysis of the MAP Kinase MPK10 Reveals an Auto-inhibitory Mechanism Crucial for Stage-Regulated Activity and Parasite Viability
- Evidence for a Transketolase-Mediated Metabolic Checkpoint Governing Biotrophic Growth in Rice Cells by the Blast Fungus
- Incomplete Deletion of IL-4Rα by LysM Reveals Distinct Subsets of M2 Macrophages Controlling Inflammation and Fibrosis in Chronic Schistosomiasis
- Identification and Functional Expression of a Glutamate- and Avermectin-Gated Chloride Channel from , a Southern Hemisphere Sea Louse Affecting Farmed Fish
- Out-of-Sequence Signal 3 as a Mechanism for Virus-Induced Immune Suppression of CD8 T Cell Responses
- Strong Epistatic Selection on the RNA Secondary Structure of HIV
- Hematopoietic but Not Endothelial Cell MyD88 Contributes to Host Defense during Gram-negative Pneumonia Derived Sepsis
- Delineation of Interfaces on Human Alpha-Defensins Critical for Human Adenovirus and Human Papillomavirus Inhibition
- Exploitation of Reporter Strains to Probe the Impact of Vaccination at Sites of Infection
- RNF26 Temporally Regulates Virus-Triggered Type I Interferon Induction by Two Distinct Mechanisms
- Helminth Infections Coincident with Active Pulmonary Tuberculosis Inhibit Mono- and Multifunctional CD4 and CD8 T Cell Responses in a Process Dependent on IL-10
- MHC Class II Restricted Innate-Like Double Negative T Cells Contribute to Optimal Primary and Secondary Immunity to
- Reactive Oxygen Species Regulate Caspase-11 Expression and Activation of the Non-canonical NLRP3 Inflammasome during Enteric Pathogen Infection
- Evolution of Plastic Transmission Strategies in Avian Malaria
- A New Human 3D-Liver Model Unravels the Role of Galectins in Liver Infection by the Parasite
- Translocates into the Myocardium and Forms Unique Microlesions That Disrupt Cardiac Function
- Mouse, but Not Human, ApoB-100 Lipoprotein Cholesterol Is a Potent Innate Inhibitor of Pneumolysin
- The Cofilin Phosphatase Slingshot Homolog 1 (SSH1) Links NOD1 Signaling to Actin Remodeling
- Kaposi's Sarcoma Herpesvirus MicroRNAs Induce Metabolic Transformation of Infected Cells
- Reorganization of the Endosomal System in -Infected Cells: The Ultrastructure of -Induced Tubular Compartments
- Distinct Dictation of Japanese Encephalitis Virus-Induced Neuroinflammation and Lethality via Triggering TLR3 and TLR4 Signal Pathways
- Exploitation of the Complement System by Oncogenic Kaposi's Sarcoma-Associated Herpesvirus for Cell Survival and Persistent Infection
- The Secreted Peptide PIP1 Amplifies Immunity through Receptor-Like Kinase 7
- Structural Insight into Host Recognition by Aggregative Adherence Fimbriae of Enteroaggregative
- The CD14CD16 Inflammatory Monocyte Subset Displays Increased Mitochondrial Activity and Effector Function During Acute Malaria
- Infection Induces Expression of a Mosquito Salivary Protein (Agaphelin) That Targets Neutrophil Function and Inhibits Thrombosis without Impairing Hemostasis
- PLOS Pathogens
- Archív čísel
- Aktuálne číslo
- Informácie o časopise
Najčítanejšie v tomto čísle- The Secreted Peptide PIP1 Amplifies Immunity through Receptor-Like Kinase 7
- Symbionts Commonly Provide Broad Spectrum Resistance to Viruses in Insects: A Comparative Analysis of Strains
- MIF Contributes to Associated Immunopathogenicity Development
- The Ins and Outs of Rust Haustoria
Prihlásenie#ADS_BOTTOM_SCRIPTS#Zabudnuté hesloZadajte e-mailovú adresu, s ktorou ste vytvárali účet. Budú Vám na ňu zasielané informácie k nastaveniu nového hesla.
- Časopisy


